
Hi everyone,
I am new to visualizing output from a binary black hole merger, and I am currently experimenting with Visit.
I have imported the surface .vtk objects for the two black holes. When I add meshes for them they appear correctly but are connected, rather than two separate entities. If this doesn't make sense I will attach a picture in a future email.
Is there a way to get rid of this in Visit?
Thanks,
Chris

Hello Chris,
I have imported the surface .vtk objects for the two black holes. When I add meshes for them they appear correctly but are connected, rather than two separate entities. If this doesn't make sense I will attach a picture in a future email.
Is there a way to get rid of this in Visit?
My guess would be that you need to ensure that each of the sets of vtk files for each of the black holes is treated by visit as a separate database.
Could you attach a sample rendering and maybe a screenshot of your VisIt window with the data loaded?
Did you take a look at the visualization tutorial here:
https://docs.einsteintoolkit.org/et-docs/GW150914_VisIt_Tutorial
It shows how to visualize the horizons in the latter part of the tutorial.
Yours, Roland
Hi Roland,
Thanks for the lightning fast response.
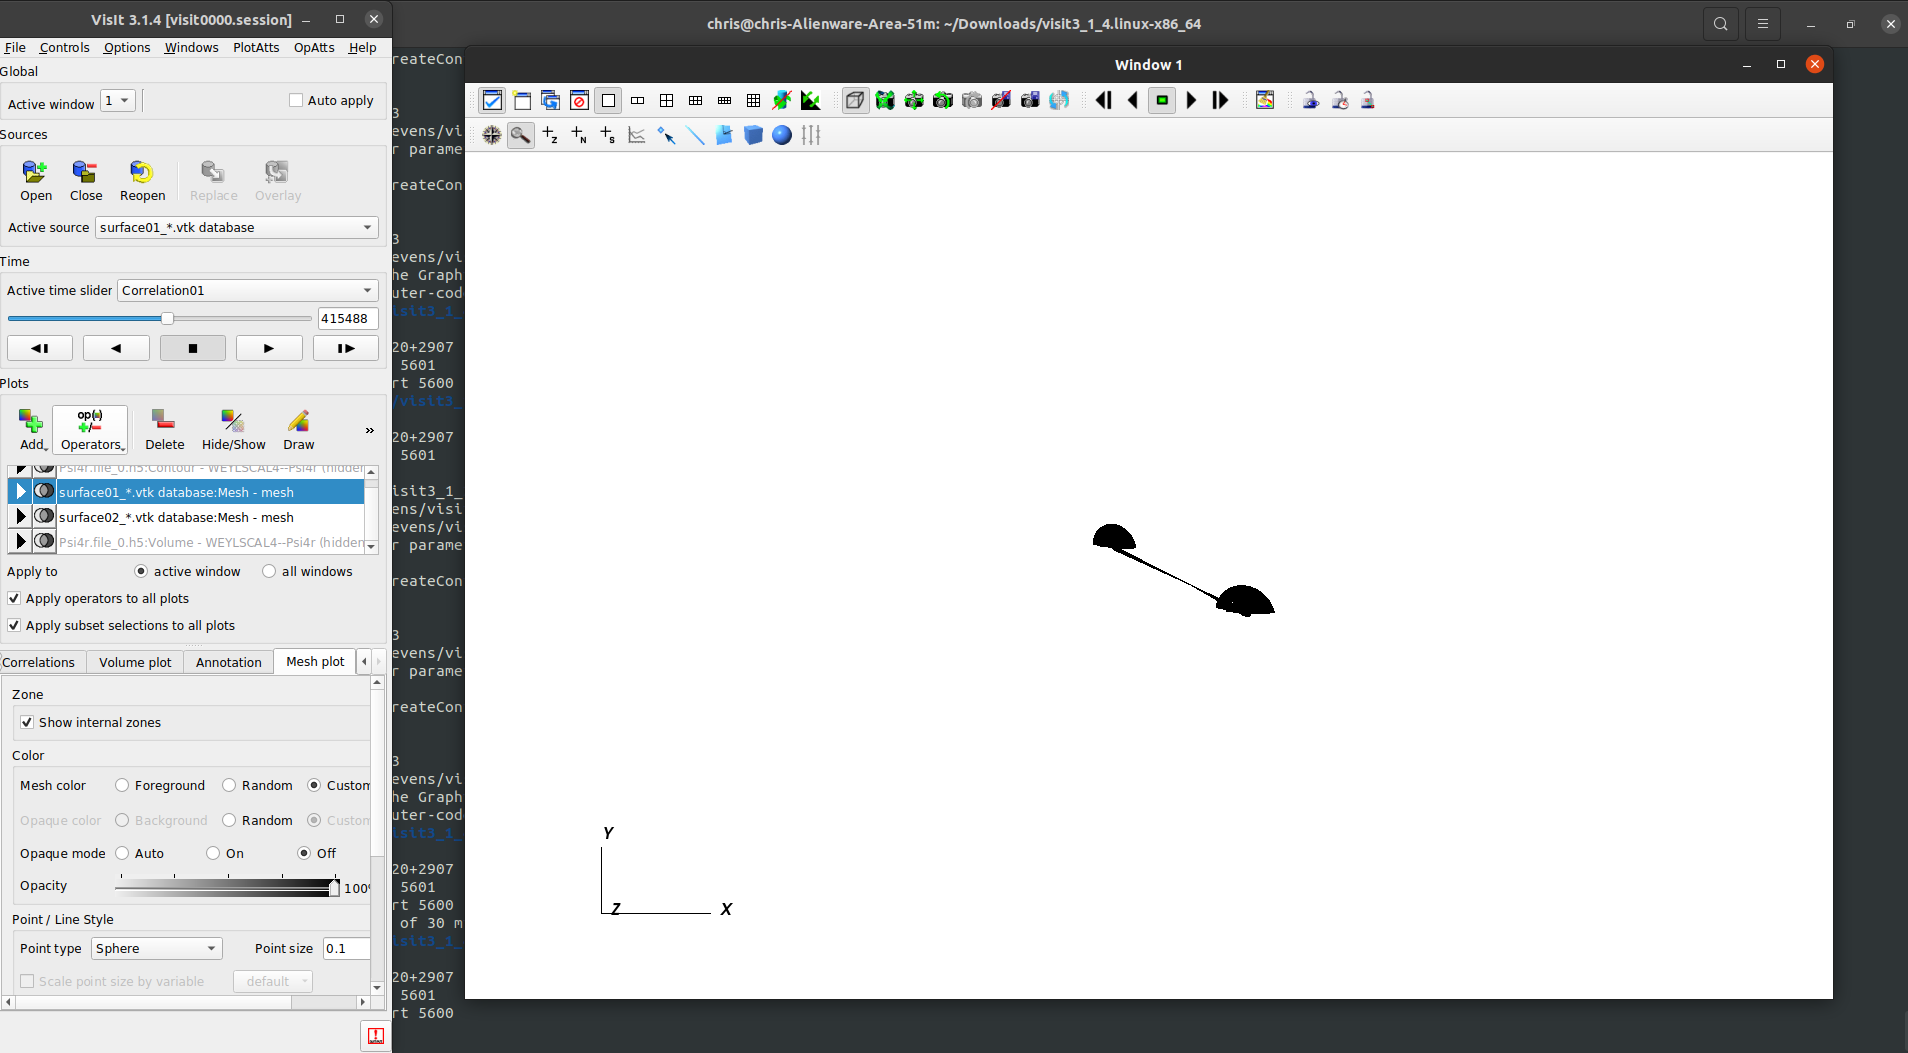
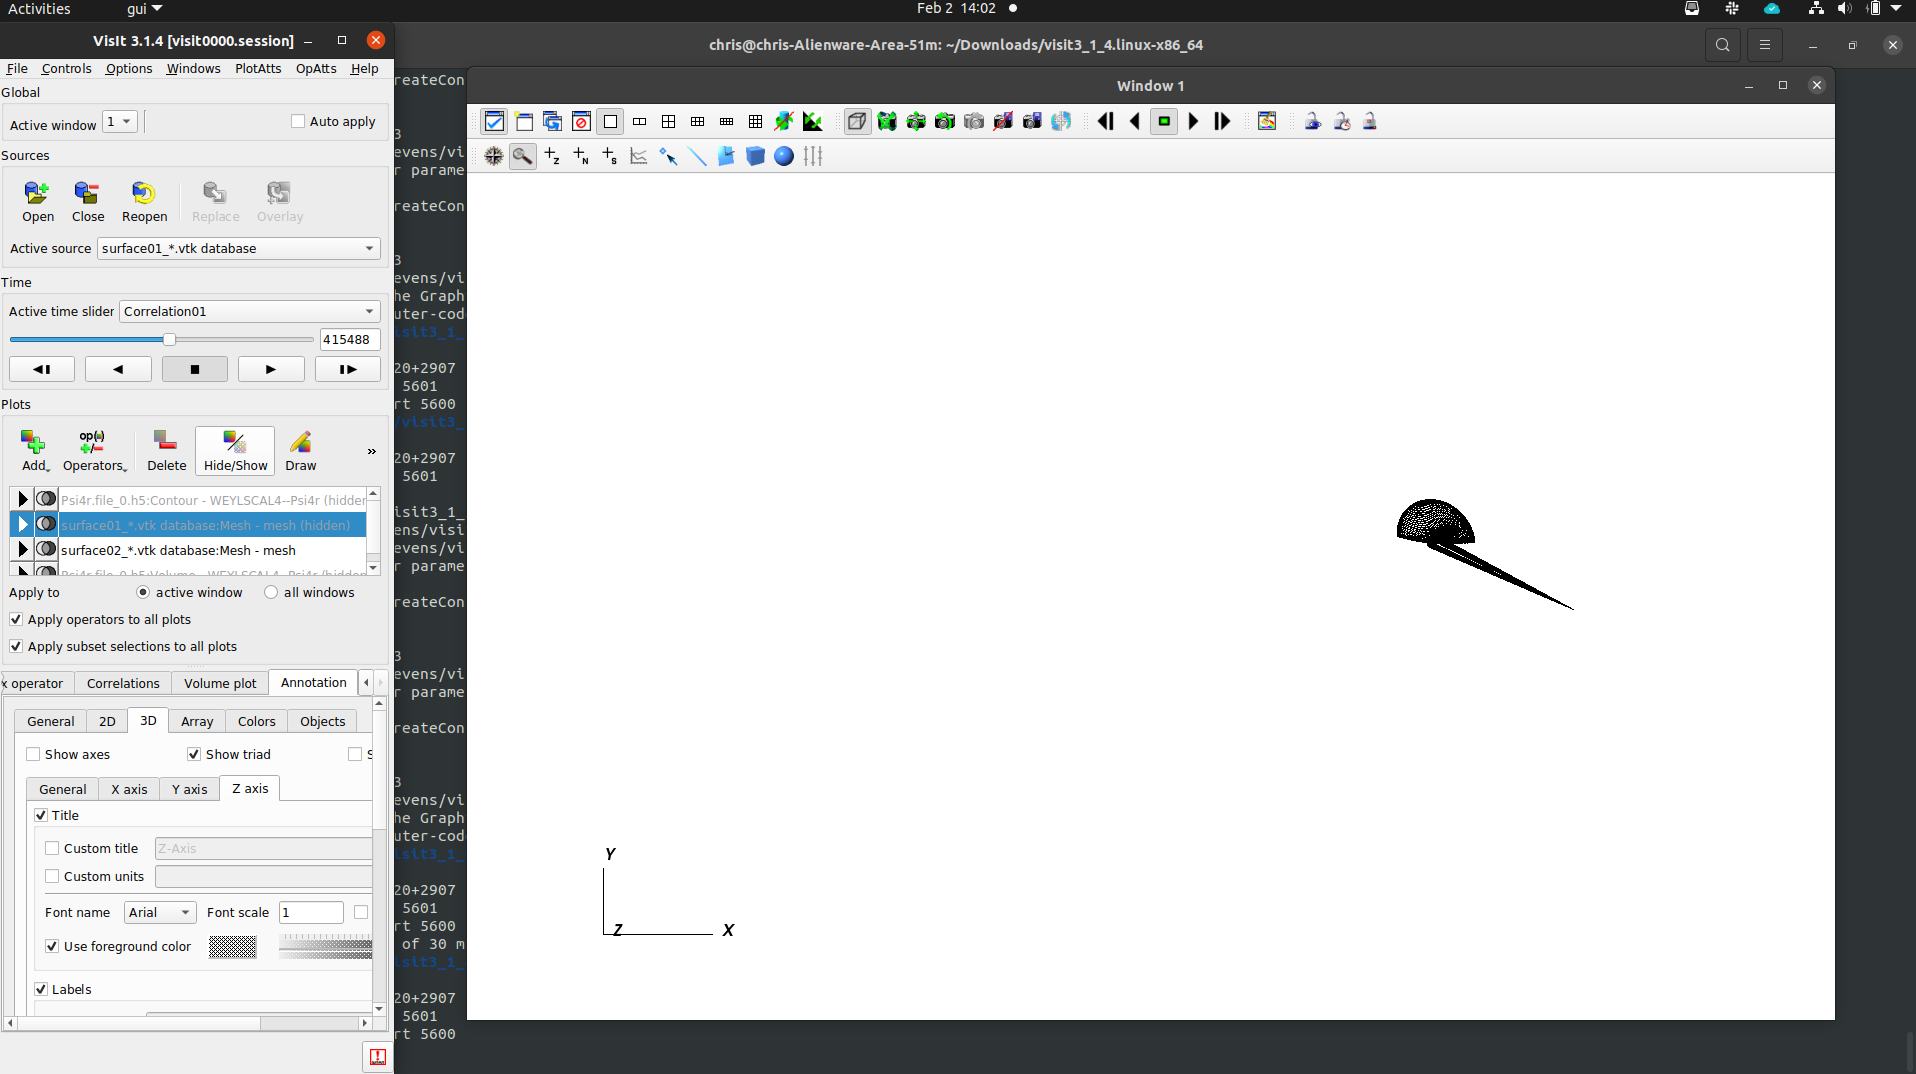
I attach some pictures to show you the issue. I am following this tutorial.
Cheers,
Chris
On Tue, 2 Feb 2021 at 13:54, Roland Haas rhaas@illinois.edu wrote:
Hello Chris,
I have imported the surface .vtk objects for the two black holes. When I add meshes for them they appear correctly but are connected, rather than two separate entities. If this doesn't make sense I will attach a picture in a future email.
Is there a way to get rid of this in Visit?
My guess would be that you need to ensure that each of the sets of vtk files for each of the black holes is treated by visit as a separate database.
Could you attach a sample rendering and maybe a screenshot of your VisIt window with the data loaded?
Did you take a look at the visualization tutorial here:
https://docs.einsteintoolkit.org/et-docs/GW150914_VisIt_Tutorial
It shows how to visualize the horizons in the latter part of the tutorial.
Yours, Roland
-- My email is as private as my paper mail. I therefore support encrypting and signing email messages. Get my PGP key from http://pgp.mit.edu .
Hello Chris,
odd. So not such much lines in between but rather that only 1/2 of the sphere is shown and each sphere has some strange protrusion to the origin.
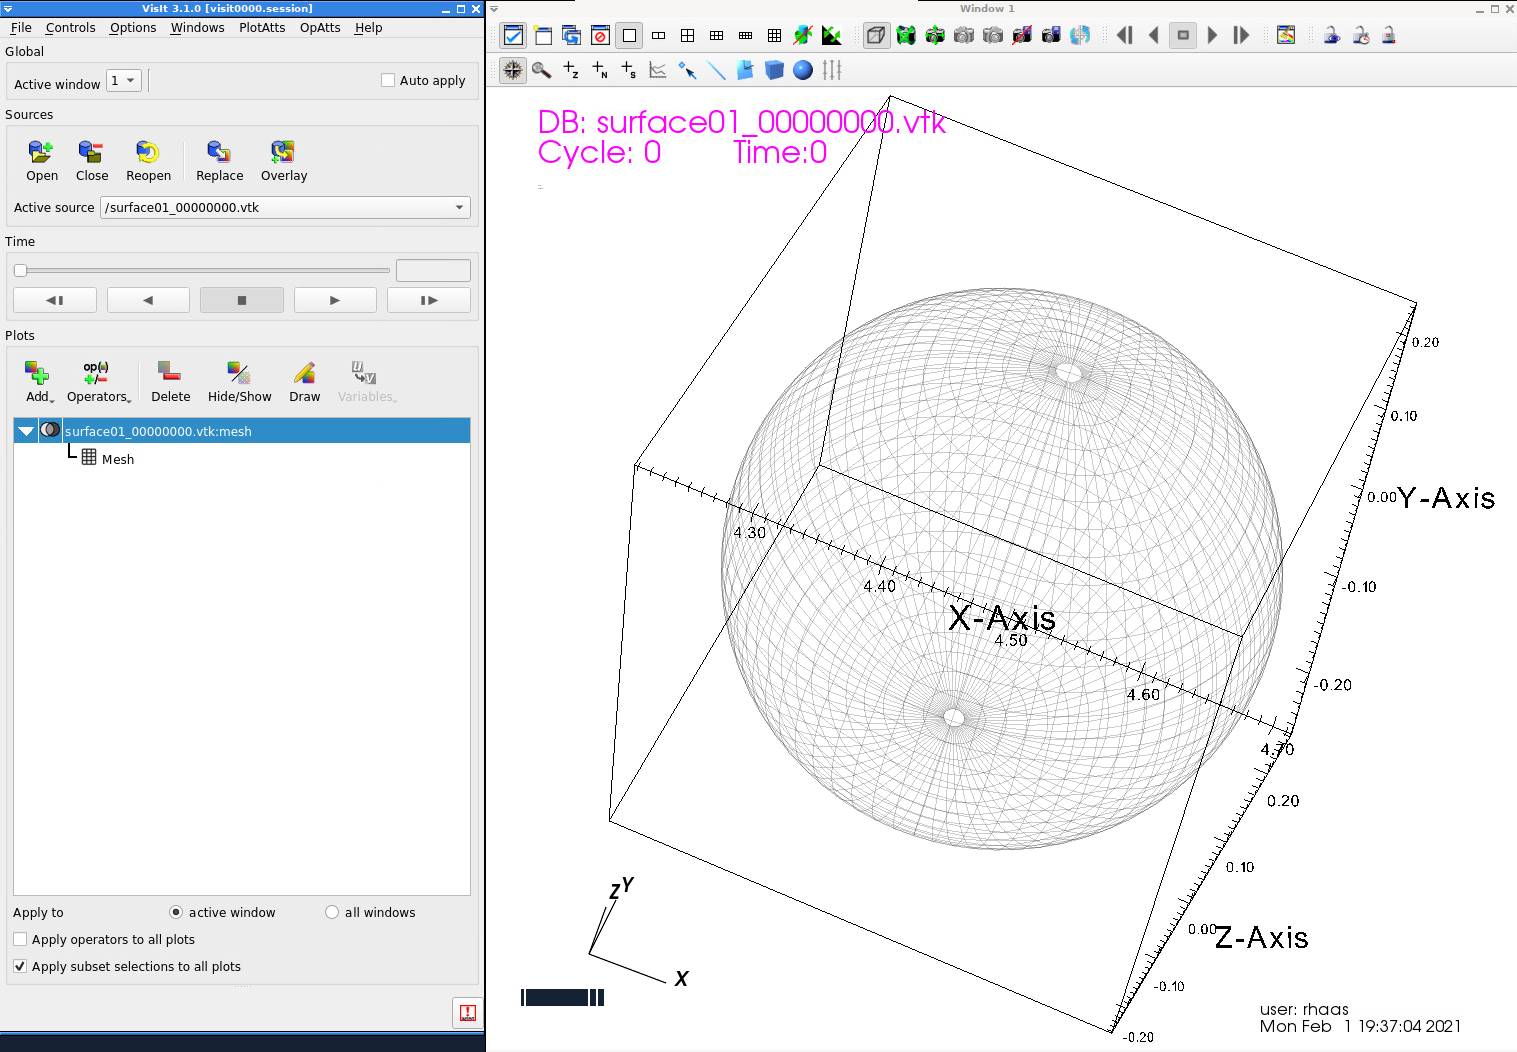
With the data for the gallery example (see https://zenodo.org/record/155394) I can visualize a sphere fine using VisIt 3.1.0 on a Linux box.
Attached please find a snapshot. The data file and VisIt session file (too big to attach) are here:
https://paste.c-net.org/HooperTawdry
Can you check that you can visualize those files?
Yours, Roland
Hi Roland,
Thanks for the lightning fast response.
I attach some pictures to show you the issue. I am following this tutorial.
Cheers,
Chris
On Tue, 2 Feb 2021 at 13:54, Roland Haas rhaas@illinois.edu wrote:
Hello Chris,
I have imported the surface .vtk objects for the two black holes. When I add meshes for them they appear correctly but are connected, rather than two separate entities. If this doesn't make sense I will attach a picture in a future email.
Is there a way to get rid of this in Visit?
My guess would be that you need to ensure that each of the sets of vtk files for each of the black holes is treated by visit as a separate database.
Could you attach a sample rendering and maybe a screenshot of your VisIt window with the data loaded?
Did you take a look at the visualization tutorial here:
https://urldefense.com/v3/__https://docs.einsteintoolkit.org/et-docs/GW15091...
It shows how to visualize the horizons in the latter part of the tutorial.
Yours, Roland
-- My email is as private as my paper mail. I therefore support encrypting and signing email messages. Get my PGP key from https://urldefense.com/v3/__http://pgp.mit.edu__;!!DZ3fjg!vsEVhG2nAymBgGMpy2... .

Hi Roland,
that works perfectly.
I attach the first surface01 .vtk file, which has this weird effect.
The simulation that output it was from the example GW150914.
Cheers,
Chris
On Tue, 2 Feb 2021 at 14:46, Roland Haas rhaas@illinois.edu wrote:
Hello Chris,
odd. So not such much lines in between but rather that only 1/2 of the sphere is shown and each sphere has some strange protrusion to the origin.
With the data for the gallery example (see https://zenodo.org/record/155394) I can visualize a sphere fine using VisIt 3.1.0 on a Linux box.
Attached please find a snapshot. The data file and VisIt session file (too big to attach) are here:
https://paste.c-net.org/HooperTawdry
Can you check that you can visualize those files?
Yours, Roland
Hi Roland,
Thanks for the lightning fast response.
I attach some pictures to show you the issue. I am following this
tutorial.
Cheers,
Chris
On Tue, 2 Feb 2021 at 13:54, Roland Haas rhaas@illinois.edu wrote:
Hello Chris,
I have imported the surface .vtk objects for the two black holes.
When I
add meshes for them they appear correctly but are connected, rather
than
two separate entities. If this doesn't make sense I will attach a
picture
in a future email.
Is there a way to get rid of this in Visit?
My guess would be that you need to ensure that each of the sets of vtk files for each of the black holes is treated by visit as a separate database.
Could you attach a sample rendering and maybe a screenshot of your VisIt window with the data loaded?
Did you take a look at the visualization tutorial here:
https://urldefense.com/v3/__https://docs.einsteintoolkit.org/et-docs/GW15091...
It shows how to visualize the horizons in the latter part of the tutorial.
Yours, Roland
-- My email is as private as my paper mail. I therefore support encrypting and signing email messages. Get my PGP key from
https://urldefense.com/v3/__http://pgp.mit.edu__;!!DZ3fjg!vsEVhG2nAymBgGMpy2... .
-- My email is as private as my paper mail. I therefore support encrypting and signing email messages. Get my PGP key from http://pgp.mit.edu .
Hello Chris,
that works perfectly.
I attach the first surface01 .vtk file, which has this weird effect.
Ok, your attached files produces bad rendering for me as well using VisIt 3.1.0.
Looking at the file (it is an ASCII file format) and comparing it to surface01_000000.vtk from the Zenodo dataset, the file is clearly different and has some very strange sections with 0.0 values in it.
The simulation that output it was from the example GW150914.
The ET gallery example parfile on linked on:
https://bitbucket.org/einsteintoolkit/einsteinexamples/raw/master/par/GW1509...
does not have vtk output enabled in QuasilocalMeasures.
Are you running the parfile from the Zenodo repo or a modified version from the gallery website? Would you mind attaching your parfile, please as well as the out and err output from Cactus?
Something strange seems to be going on in your vtk output I would say, though I have no idea what might be happening.
Having said that, I ran the gallery example parfile using the Turing (ET_2020_05, mostly b/c I had a copy already compiled) after setting:
QuasiLocalMeasures::output_vtk_every = 1
and its t=0 output for surface01_000000.vtk looks just like your bad one.
Running diff on the parameter files (from the galley page and Zenodo) the only differences I see are that WaveExtractCPM (not in the Einstein Toolkit) is disabled in the gallery version and that ADMConstraints has been replaced by ML_ADMConstraints.
You may want to try if correct output is restored after running:
cd repos/einsteinanalysis git revert 56a98ded
and recompiling.
This reverts a commit "QuasiLocalModes: Simplify VTK output routine to speed up build times" which has a suggestive commit message.
I would suggest creating a bug report ticket.
Yours, Roland
Hi Roland,
I'm glad it's not just me. A link to the requested files:
https://u.pcloud.link/publink/show?code=XZF1AbXZ3Cm7SlrPOF0Wh0VR5FnMVVPB2cRk
From memory the 3D output was not enabled by default, so
QuasiLocalMeasures::output_vtk_every = $out3d_every Was not enabled. I think that variable is the only thing I changed, which is now
out3d_every = rl0_every * 2
instead of 0.
I will try to log a bug report as soon as I can. I am in the middle of a bunch of grant applications and will probably only get time this weekend.
Thanks as always for your quick and useful advice,
Chris
On Wed, 3 Feb 2021 at 04:46, Roland Haas rhaas@illinois.edu wrote:
Hello Chris,
that works perfectly.
I attach the first surface01 .vtk file, which has this weird effect.
Ok, your attached files produces bad rendering for me as well using VisIt 3.1.0.
Looking at the file (it is an ASCII file format) and comparing it to surface01_000000.vtk from the Zenodo dataset, the file is clearly different and has some very strange sections with 0.0 values in it.
The simulation that output it was from the example GW150914.
The ET gallery example parfile on linked on:
https://bitbucket.org/einsteintoolkit/einsteinexamples/raw/master/par/GW1509...
does not have vtk output enabled in QuasilocalMeasures.
Are you running the parfile from the Zenodo repo or a modified version from the gallery website? Would you mind attaching your parfile, please as well as the out and err output from Cactus?
Something strange seems to be going on in your vtk output I would say, though I have no idea what might be happening.
Having said that, I ran the gallery example parfile using the Turing (ET_2020_05, mostly b/c I had a copy already compiled) after setting:
QuasiLocalMeasures::output_vtk_every = 1
and its t=0 output for surface01_000000.vtk looks just like your bad one.
Running diff on the parameter files (from the galley page and Zenodo) the only differences I see are that WaveExtractCPM (not in the Einstein Toolkit) is disabled in the gallery version and that ADMConstraints has been replaced by ML_ADMConstraints.
You may want to try if correct output is restored after running:
cd repos/einsteinanalysis git revert 56a98ded
and recompiling.
This reverts a commit "QuasiLocalModes: Simplify VTK output routine to speed up build times" which has a suggestive commit message.
I would suggest creating a bug report ticket.
Yours, Roland
-- My email is as private as my paper mail. I therefore support encrypting and signing email messages. Get my PGP key from http://pgp.mit.edu .
Hello all,
to close off this email thread:
Chris created a ticket
https://bitbucket.org/einsteintoolkit/tickets/issues/2496/error-in-vtk-surfa...
and Erik implemented a fix in 380fe756 "QuasiLocalMeasures: Correct array indexing" of einsteinanalysis which fixes the issue.
Yours, Roland
Hi Roland,
I'm glad it's not just me. A link to the requested files:
https://urldefense.com/v3/__https://u.pcloud.link/publink/show?code=XZF1AbXZ...
From memory the 3D output was not enabled by default, so
QuasiLocalMeasures::output_vtk_every = $out3d_every Was not enabled. I think that variable is the only thing I changed, which is now
out3d_every = rl0_every * 2
instead of 0.
I will try to log a bug report as soon as I can. I am in the middle of a bunch of grant applications and will probably only get time this weekend.
Thanks as always for your quick and useful advice,
Chris
On Wed, 3 Feb 2021 at 04:46, Roland Haas rhaas@illinois.edu wrote:
Hello Chris,
that works perfectly.
I attach the first surface01 .vtk file, which has this weird effect.
Ok, your attached files produces bad rendering for me as well using VisIt 3.1.0.
Looking at the file (it is an ASCII file format) and comparing it to surface01_000000.vtk from the Zenodo dataset, the file is clearly different and has some very strange sections with 0.0 values in it.
The simulation that output it was from the example GW150914.
The ET gallery example parfile on linked on:
https://urldefense.com/v3/__https://bitbucket.org/einsteintoolkit/einsteinex...
does not have vtk output enabled in QuasilocalMeasures.
Are you running the parfile from the Zenodo repo or a modified version from the gallery website? Would you mind attaching your parfile, please as well as the out and err output from Cactus?
Something strange seems to be going on in your vtk output I would say, though I have no idea what might be happening.
Having said that, I ran the gallery example parfile using the Turing (ET_2020_05, mostly b/c I had a copy already compiled) after setting:
QuasiLocalMeasures::output_vtk_every = 1
and its t=0 output for surface01_000000.vtk looks just like your bad one.
Running diff on the parameter files (from the galley page and Zenodo) the only differences I see are that WaveExtractCPM (not in the Einstein Toolkit) is disabled in the gallery version and that ADMConstraints has been replaced by ML_ADMConstraints.
You may want to try if correct output is restored after running:
cd repos/einsteinanalysis git revert 56a98ded
and recompiling.
This reverts a commit "QuasiLocalModes: Simplify VTK output routine to speed up build times" which has a suggestive commit message.
I would suggest creating a bug report ticket.
Yours, Roland
-- My email is as private as my paper mail. I therefore support encrypting and signing email messages. Get my PGP key from https://urldefense.com/v3/__http://pgp.mit.edu__;!!DZ3fjg!rsT23Ronv7kJTdkMXq... .
users@lists.einsteintoolkit.org
-
 Chris Stevens
 -
 Chris Stevens
 -
 Roland Haas