
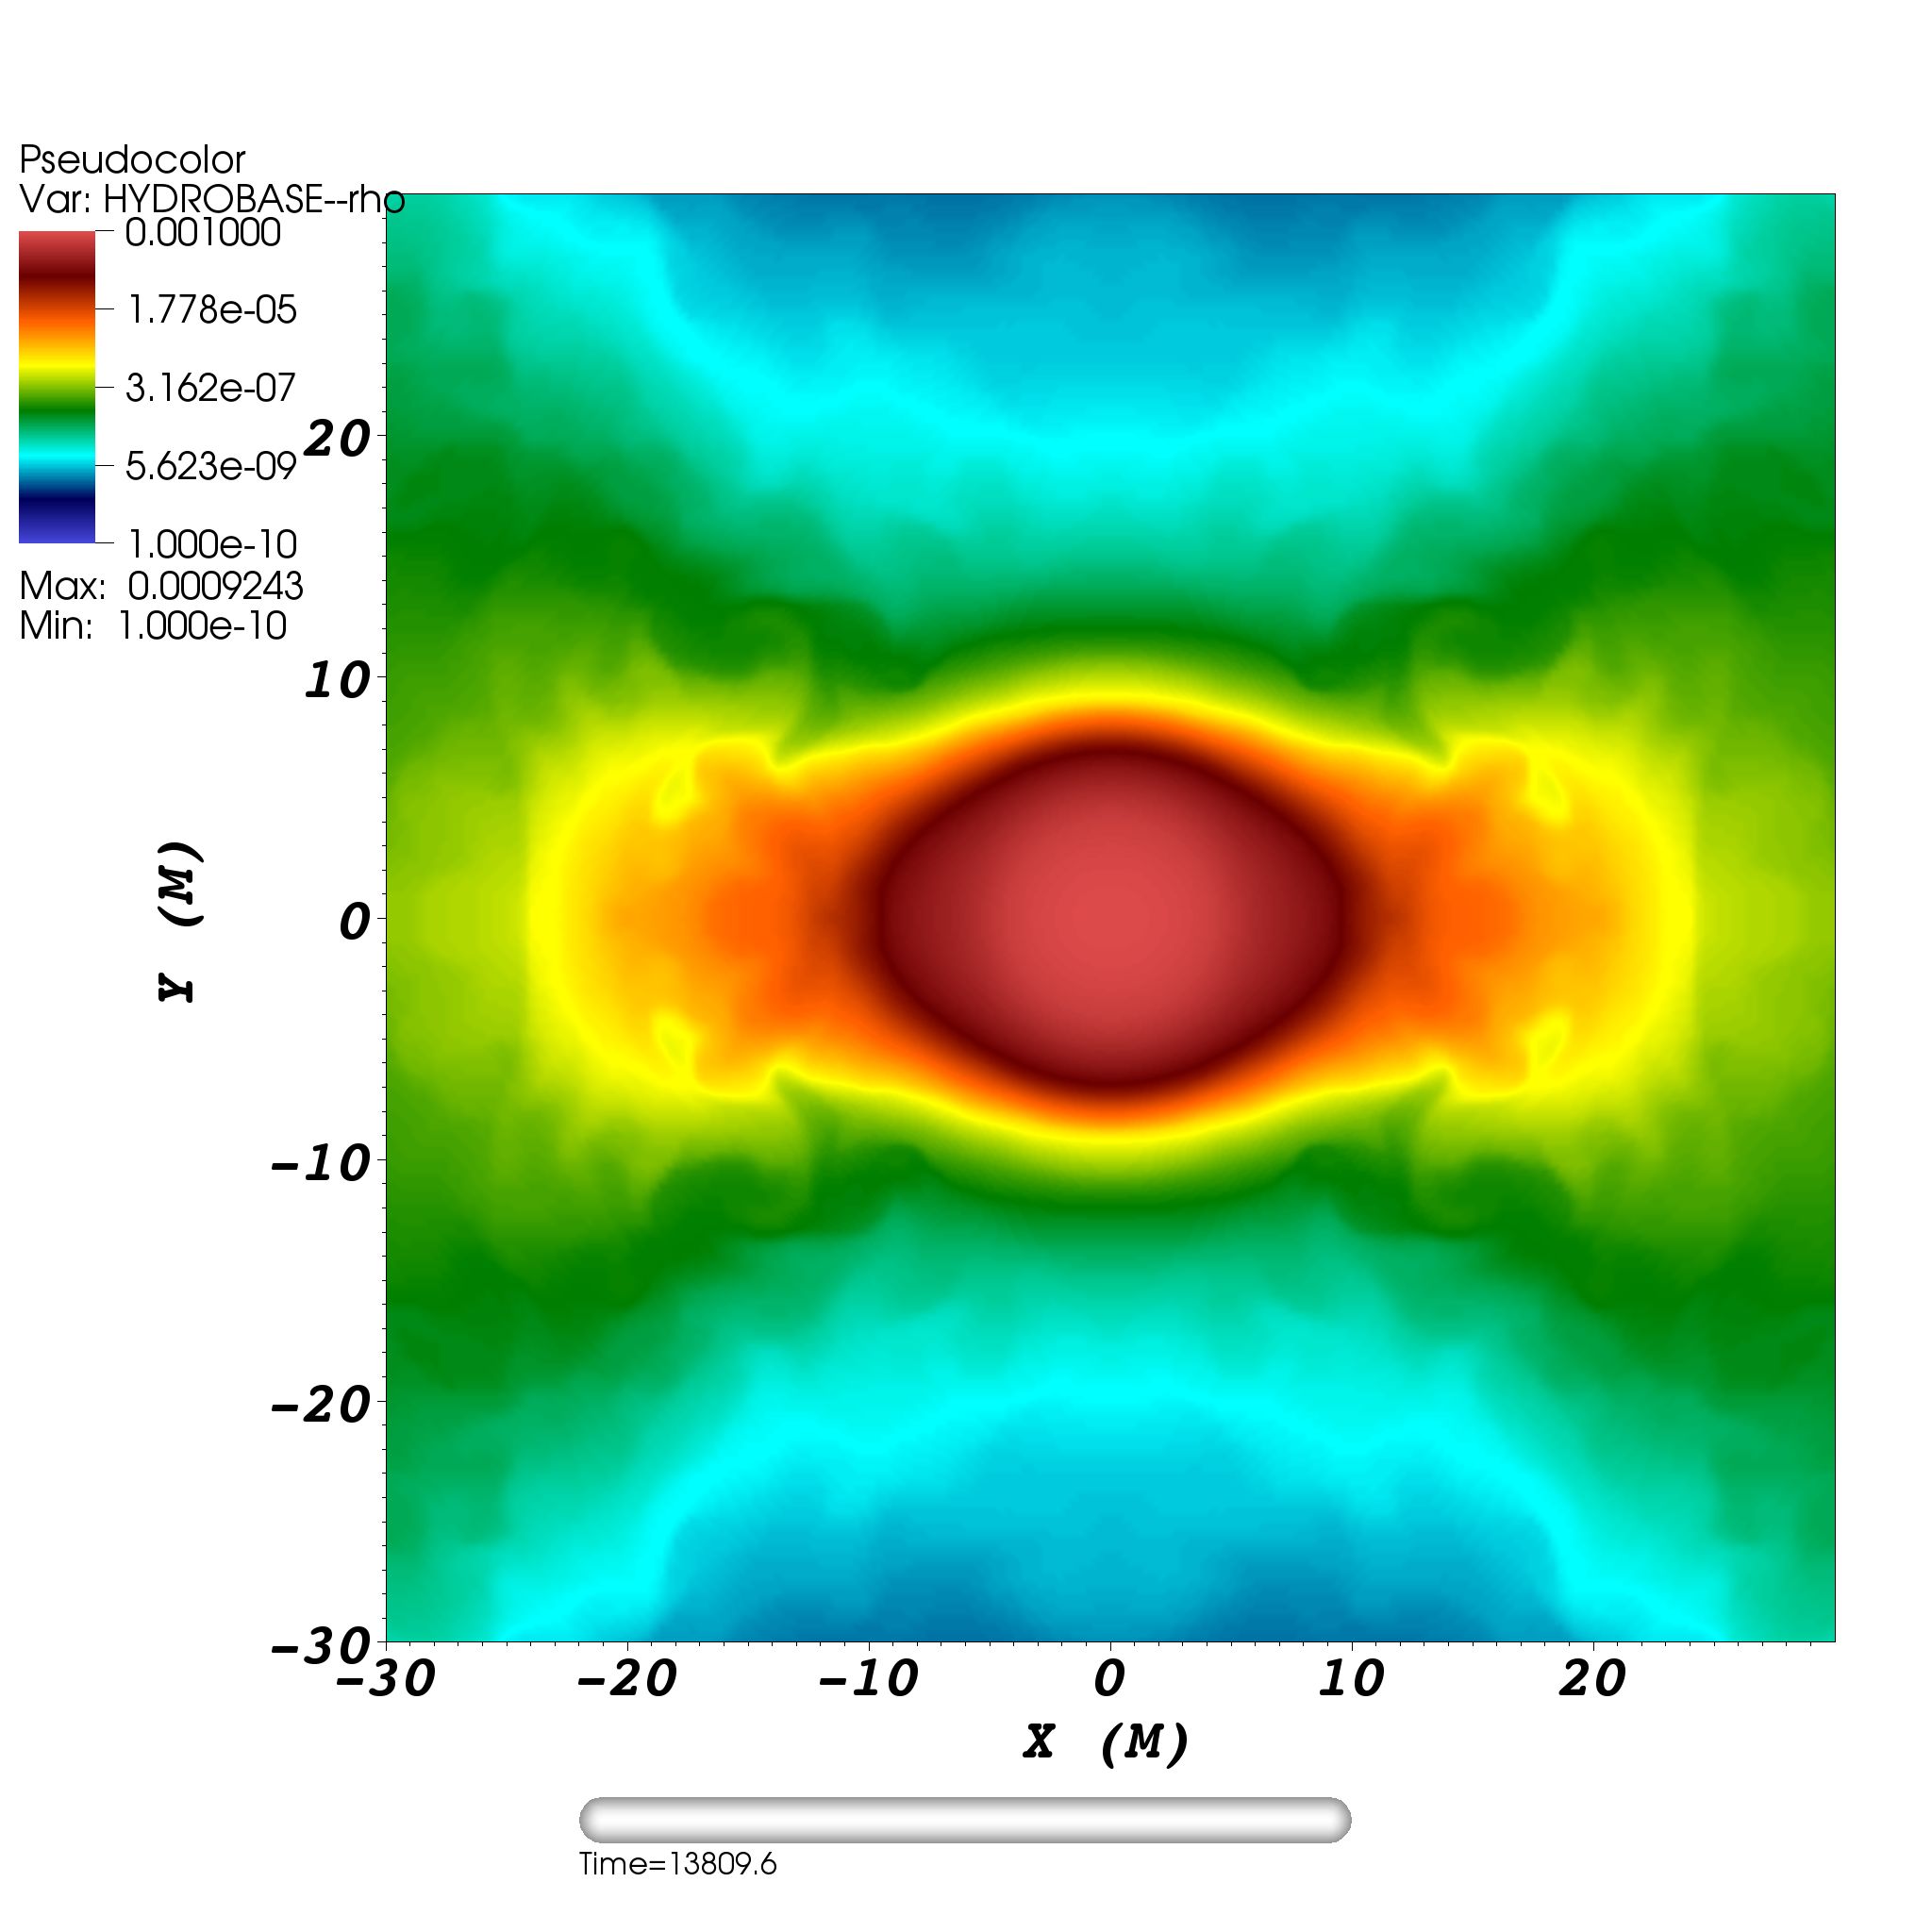
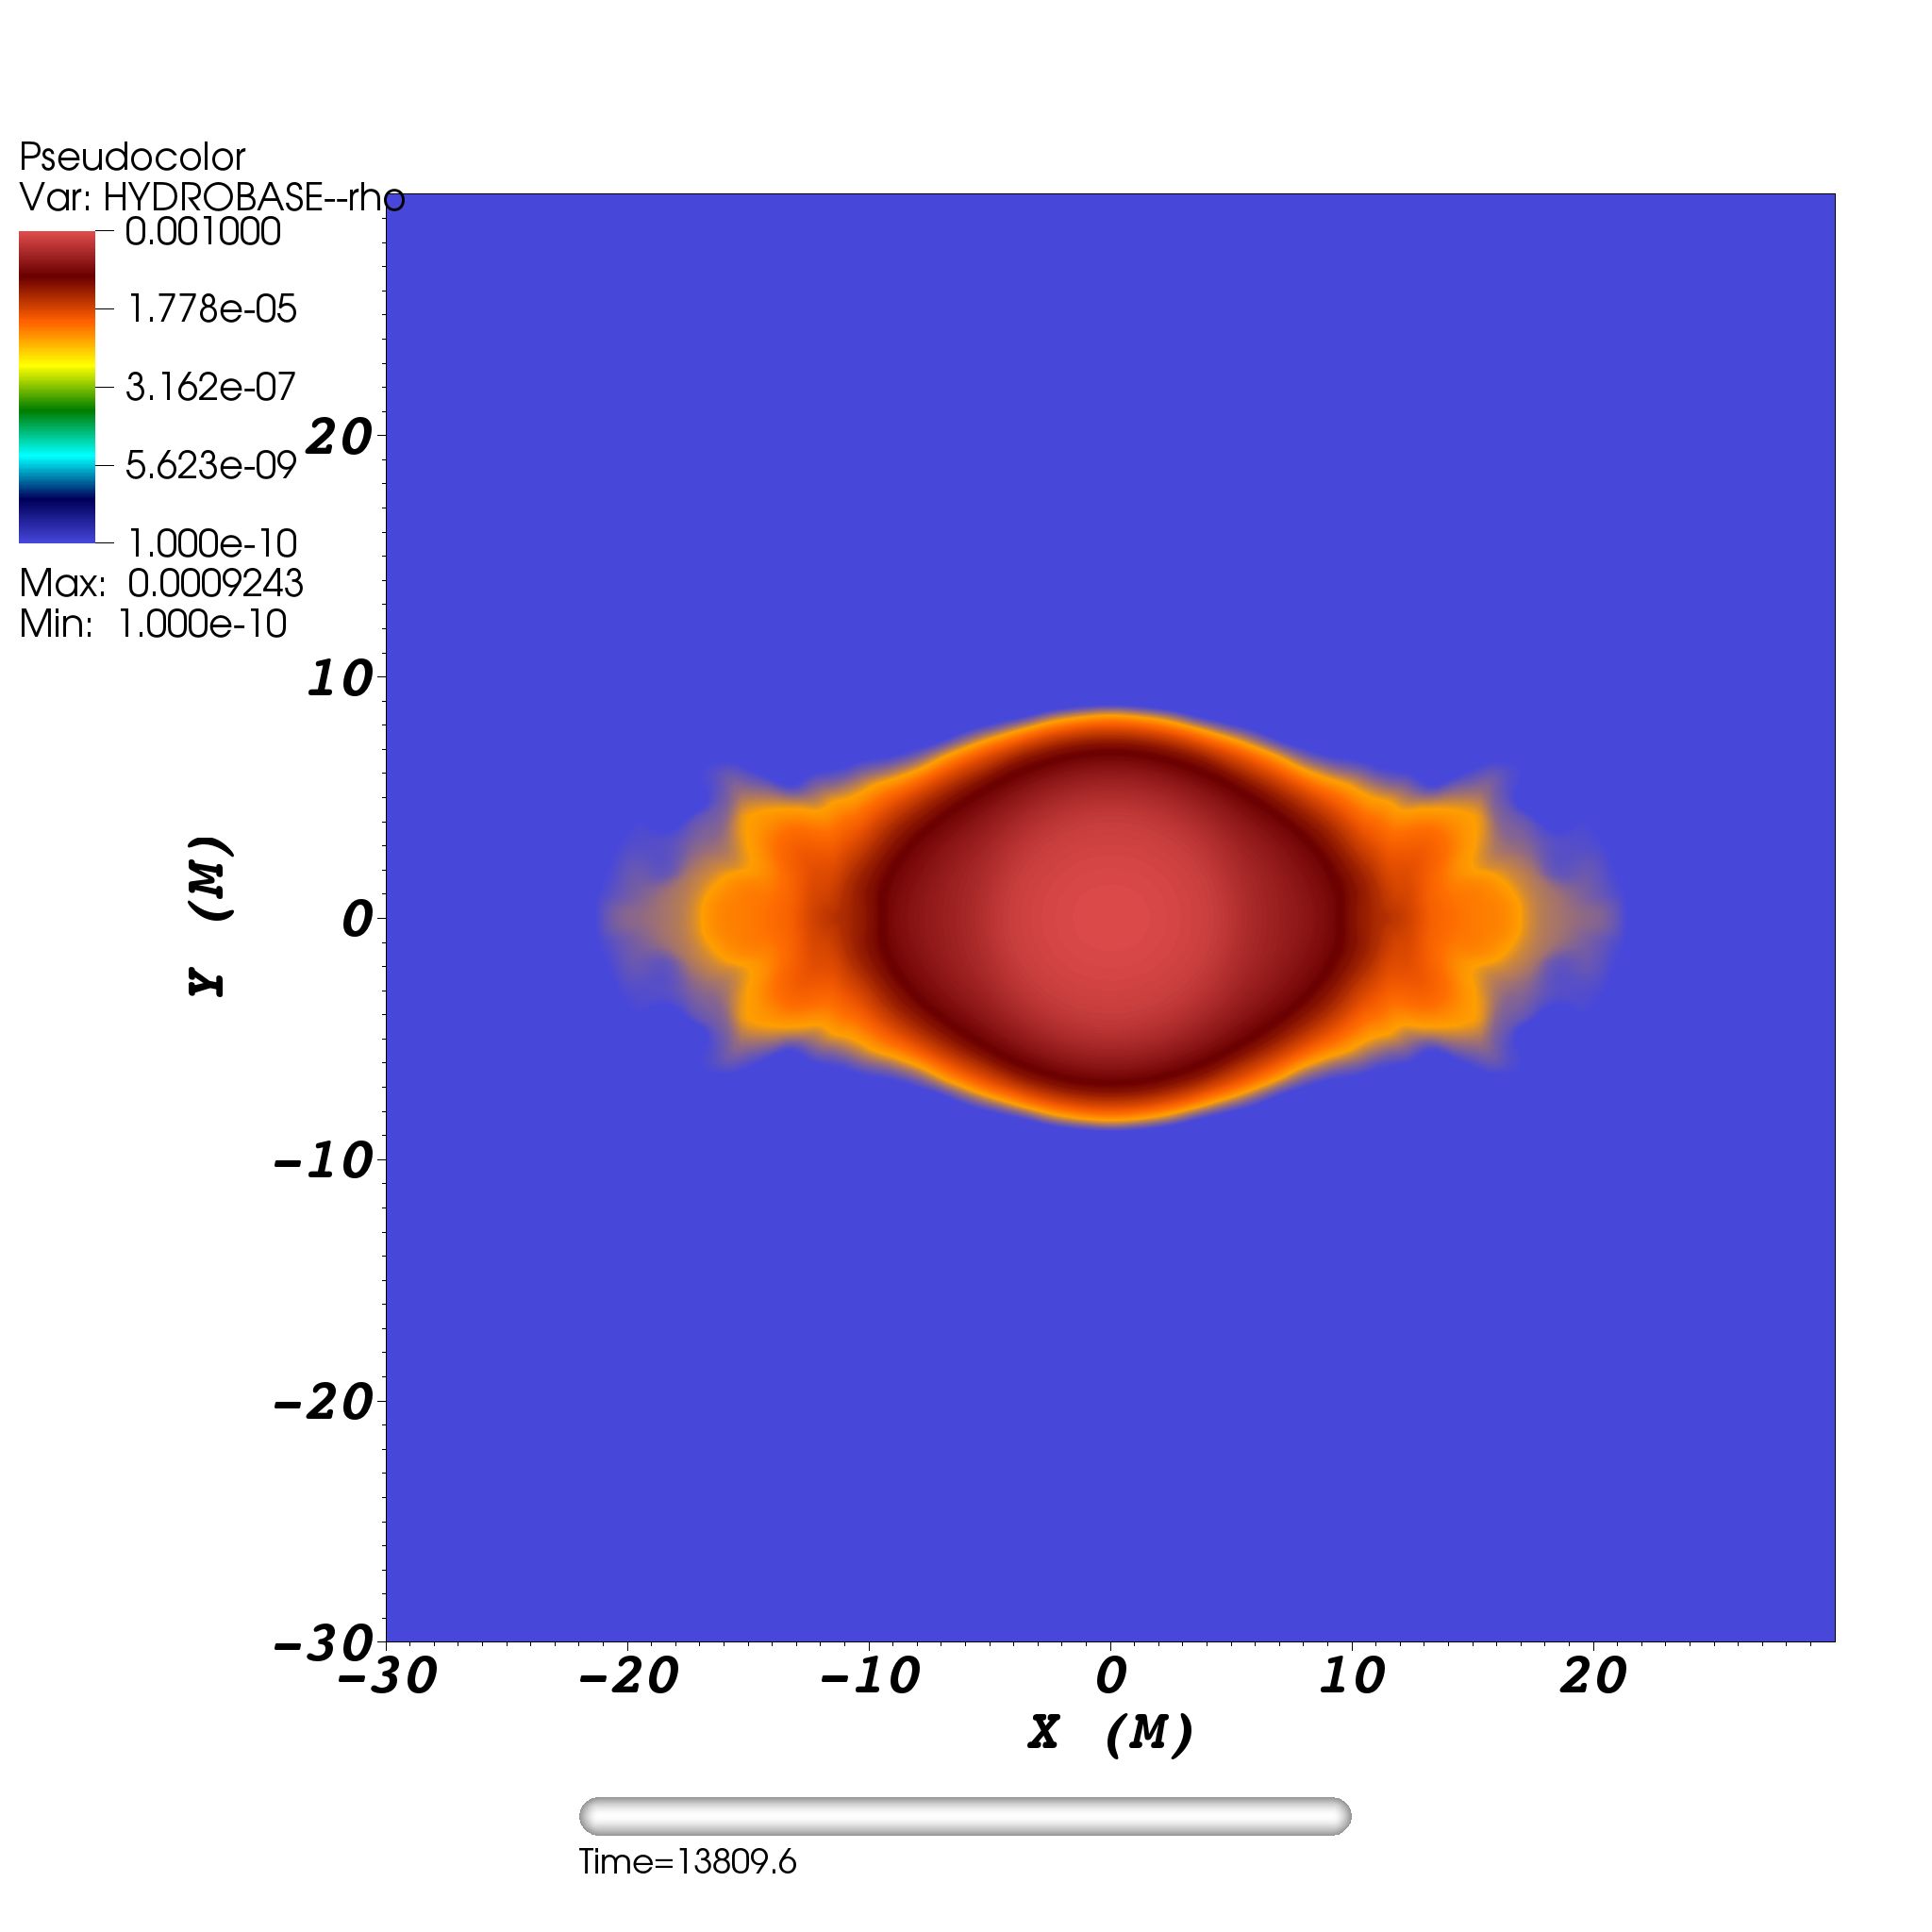
Hi, I have some issues using the latest version of Visit. When visualizing data in CarpetHDF5 format for some reasons VisIt does not show properly all the values, i.e., values below a certain threshold are visualized using the same color of the minimum in the colorbar. I have attached two images to make it more clear: rho_visit_263.jpeg shows the density using version 2.6.3, while rho_visit_232.jpeg shows the same quantity but using version 2.3.2. As you can see, 2.6.3 does not show properly the values below ~1e-6 (they all get the same color of 1e-10).
I tried both the binary and source versions of visit 2.6.3 and they both show the same problem. I also tried the 2.6.0 binary version and it shows the same problem too. Any idea of what's going on?
Thanks, Bruno
Dr. Bruno Giacomazzo JILA - University of Colorado 440 UCB Boulder, CO 80309 USA
Tel. : +1 303-492-5170 Fax : +1 303-492-5235 email : bruno.giacomazzo@jila.colorado.edu web: http://www.brunogiacomazzo.org
---------------------------------------------------------------------- There are only 10 types of people in the world: Those who understand binary, and those who don't ----------------------------------------------------------------------

Hello Bruno.
I tried both the binary and source versions of visit 2.6.3 and they both show the same problem. I also tried the 2.6.0 binary version and it shows the same problem too. Any idea of what's going on?
I would try and see if the difference is due to cell vs. node plotting (ie the Centering option of a pseudocolorplot which can be natural, nodal or zonal).
Yours, Roland
Roland, thanks for the suggestion. Zonal shows also the lower density region (and it produces the same results of Zonal with Visit 2.3.2), while Nodal and Original don't. Is this behavior expected? Is there a way to change it?
Thanks, Bruno
On Jul 27, 2013, at 12:26 PM, Roland Haas wrote:
Hello Bruno.
I tried both the binary and source versions of visit 2.6.3 and they both show the same problem. I also tried the 2.6.0 binary version and it shows the same problem too. Any idea of what's going on?
I would try and see if the difference is due to cell vs. node plotting (ie the Centering option of a pseudocolorplot which can be natural, nodal or zonal).
Yours, Roland
-- My email is as private as my paper mail. I therefore support encrypting and signing email messages. Get my PGP key from http://keys.gnupg.net.
Users mailing list Users@einsteintoolkit.org http://lists.einsteintoolkit.org/mailman/listinfo/users
Dr. Bruno Giacomazzo JILA - University of Colorado 440 UCB Boulder, CO 80309 USA
Tel. : +1 303-492-5170 Fax : +1 303-492-5235 email : bruno.giacomazzo@jila.colorado.edu web: http://www.brunogiacomazzo.org
---------------------------------------------------------------------- There are only 10 types of people in the world: Those who understand binary, and those who don't ----------------------------------------------------------------------
users@lists.einsteintoolkit.org
-
 Bruno Giacomazzo
 -
 Roland Haas