Dear Gabriele,
Thanks for the reply, this is very close to what I want to achieve!
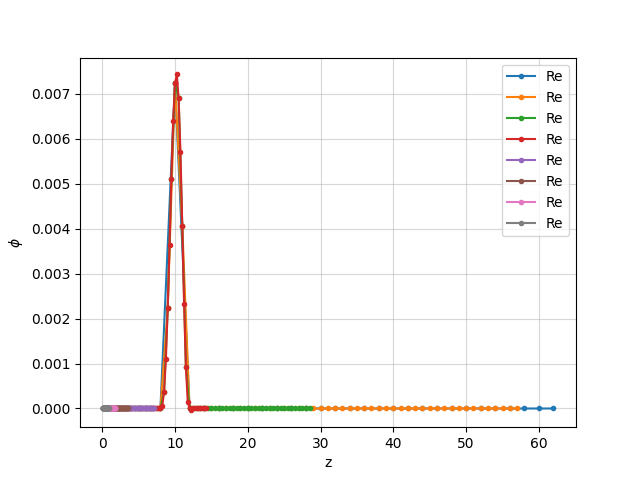
The code and the corresponding image that I obtain using your suggestion are
|sd = SimDir("<output>") ts = sd.timeseries gf = sd.gf phi1 = gf.z["phi1"] phi1_0 = phi1.get_time(0) fig = plt.figure() ax1 = fig.add_subplot(111) for ref_level, component, grid_data in phi1_0: ax1.plot(grid_data.coordinates_meshgrid()[0], grid_data.data, marker=".", label="Re") ax1.grid(alpha=0.5) ax1.set_xlabel("z") ax1.set_ylabel(r"$\phi$") ax1.legend(); |
Because all of the points on the y-axis are overlapping, which I imagine they always will because we I’m working with box-in-a-box, I’m sure that I merge the coordinate grids on the x-axis and the values on the y-axis into two distinct arrays.
However, I do have a few issues:
1.
The physical boundaries of the grid as provided in the parfile (in this case are zmin=0 to zmax=64) are cropped for all refinement levels, and none of them hit z=0 nor z=64. What could be the cause of this? In my parfile |CarpetIOHDF5| is configured to save ghost and boundary points, but not symmetry points;
2.
The intersections between the different refinement levels do not match. In my parfile, the refinement levels are 48, 24, 12, 6, 3, 1.5 and 0.75, which does not add up with the intersection on the plot above. For instance, the second refinement level (in orange) spans all the way to z=57 even though I expected it to go as far as z=48. I expected it to hit exactly z=48 because, according to the documentation
When initializing an HierarchicalGridData, kuibit will make an effort to put all the different patches back together. If the provided components cover an entire grid, kuibit will merge them. In doing this, all the ghost zone information is discarded
As for Bruno’s suggestion, I will look into the script in more detail, and correct me if I’m wrong, but I think the main idea seems to be more or less the same, where there’s an explicit call to |iter_from_finest()| to generate the iterator.
Thank you to both of you,
Best,
José
On 09/10/24 11:00, Bruno Giacomazzo wrote:
Steve Brandt produced the attached script to plot raw data without interpolation using Kuibit. The script is for 2D data, but I assume the same can be done with 1D data.
Cheers, Bruno
Il giorno mar 8 ott 2024 alle ore 19:53 Gabriele Bozzola bozzola.gabriele@gmail.com ha scritto:
Hi José, Dealing with plotting a hierarchical grid in full generality (with/without ghost zones, handling multiple possibly overlapping components, ...) is a hard problem. This is especially the case for 2/3D grids, which are commonly plotted with heatmaps/colormaps. To go around this, we resample the grids to a uniform grid for plotting purposes. In kuibit, these are "UniformGridData". These can be plotted directly. In the 1D case, we can just resample everything onto the finest grid, and that's why you see more points. By default, the resampling method is just nearest neighbor, so this method is not making data up, just adding more "intermediate" points where there are fewer. Indeed, as you say, HierarchicalGridData objects have all the information to plot one level at the time and it is probably feasible to use them for simple 1D plots. `HierarchicalGridData` can be iterated over: when you iterate over with something like: for ref_level, component, grid_data in hier_grid: Here you plot the grid_data (I haven't tested this) kuibit also has a method `to_GridSeries()`. This is a specialized method for 1D variables. Currently, this is only implemented for UniformGridData, so you'd have to merge the refinement levels to use it. We could extend it to HierarchicalGridData and instead of resampling to the finest grid, we'd just collect all the points. In this way, you could just call this method and call `plt.plot` to have a line plot (as you do with timeseries in kuibit). This should be straightforward (it's essentially what I sketched above) and I can guide you to the implementation if that's something you'd be interested in contributing. Please, let me know if this helps, Gabriele On Tue, Oct 8, 2024 at 10:05 AM José Ferreira <jpmferreira@ua.pt> wrote: Dear toolkit community, I’m struggling to find a way to plot a 1D quantity in Kuibit without merging the different meshes originated from the mesh refinement. As a workaround, I have made a Python script that reads the file of a grid function and plots every point along the axis and its corresponding value. I can share this script if somebody is interested, but it is not very good as it breaks once you use checkpoints and has hardcoded paths. However, it gets the job done, as you can see in an example plot below, where it is hopefully obvious that there is an increase in the number of points as z approaches 0. Obviously, a solution that uses Kuibit would be much better. However, I cannot come up with such a solution and so I’m writing this e-mail. From the documentation, the object that represents the simulation data (including the mesh refinement levels), is the |HierarchicalGridData|, and I know how to go from a grid function to this object. For instance, to get the |HierarchicalGridData| that represents the real part of a scalar field along the x-axis at t=0, we do |sd = SimDir("<output>") gf = sd.gf <http://sd.gf> phi1=gf.x["phi1"].get_time(0) | All I have to do now is plot this somehow. As it turns out, this is impossible, because according to the documentation We cannot plot directly this object, because it is a complicated object. To plot it, we have to merge the refinement levels to a single |UniformGridData|. We can do this with |refinement_levels_merged()|. But, all of the information regarding the mesh refinement levels is here, so it should be possible to extract this information and plot it, right? Looking at the methods and variables in |HierarchicalGridData| I came up with nothing. Does anybody have a solution to this? Thank you in advance, Best Regards, José Ferreira _______________________________________________ Users mailing list Users@einsteintoolkit.org http://lists.einsteintoolkit.org/mailman/listinfo/users _______________________________________________ Users mailing list Users@einsteintoolkit.org http://lists.einsteintoolkit.org/mailman/listinfo/users--
Prof. Bruno Giacomazzo Department of Physics University of Milano-Bicocca Piazza della Scienza 3 20126 Milano Italy
email: bruno.giacomazzo@unimib.it phone: (+39) 02 6448 2321 web: http://www.brunogiacomazzo.org
There are only 10 types of people in the world: Those who understand binary, and those who don't