
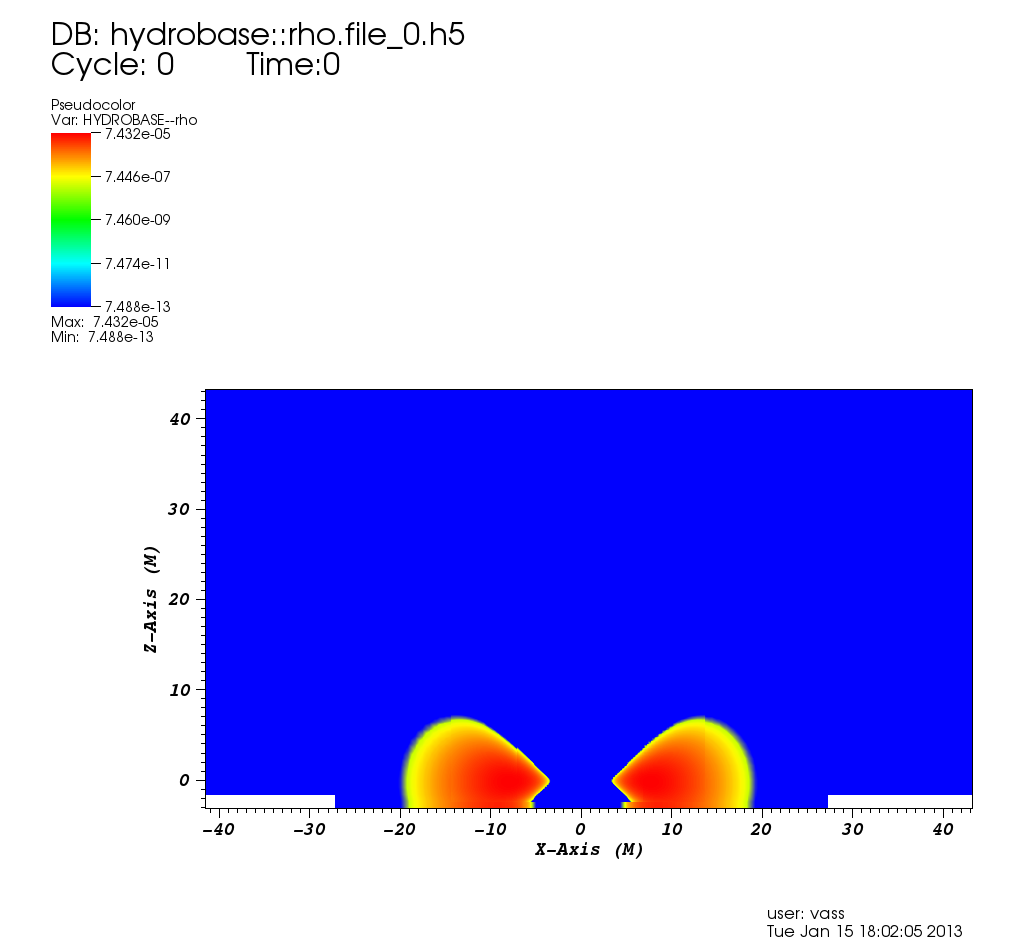
sorry for the messages before, hopefully the mail is now small enough, but i thought that adding a plot might explain better what i mean..
Hello all,
i recently read the Reisswig et al. 2012 paper and started trying to switch to cell-centered grid in order to be able to use the LSUThorns/Refluxing thorn. i am trying to simulate BH+torus systems and due to the size of the torus its hard to have it contained within a refinement level, so i thought that using a cell-centered grid in order to use refluxing might improve results..
i however run into problems getting the hdf5 output of 3D grid frundtions to work...
using the static_tov_cc_rf.par file from the Refluxing trunk, i get weird output in the mesh at the reflection boundaries (the par file uses octant mode)..
i am using the following parameters for CarpetIOHDF5:
IOHDF5::out_every = 256 IOHDF5::one_file_per_group = no IOHDF5::output_symmetry_points = no IOHDF5::out3D_ghosts = no IOHDF5::output_ghost_points = no IOHDF5::out3D_outer_ghosts = no IOHDF5::output_boundary_points = no IOHDF5::output_buffer_points = no IOHDF5::compression_level = 9 IOHDF5::use_checksums = yes IOHDF5::out_vars = " HydroBase::rho HydroBase::press HydroBase::eps HydroBase::vel ADMBase::lapse ADMBase::metric ADMBase::curv GRHydro::scon "
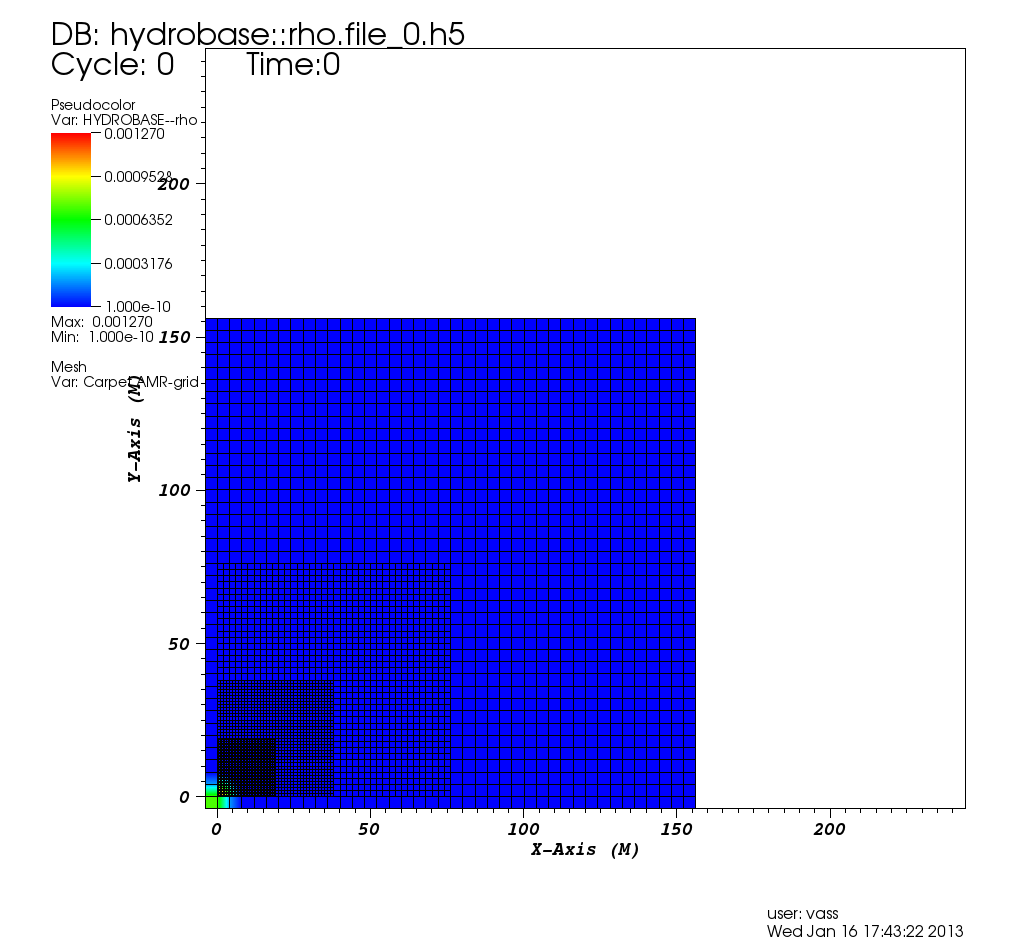
the simulations seems to work fine, so is the carpetiohdf5 thorn not suitable for cell-centered output? another effect (that might be output related) is that the different refinement levels are shifted (i'll attach a file showing this in the TOV from the par file (i added extra refinement levels to illustrate the effect) as well as a plot of the density in the torus)...
are the specific parameters for cell-centered hdf5 output or other thorns that could take care of that?
best wishes,
Vassili

Vassili
By default, the symmetry boundary points are output. This often leads to strange-looking data, as the symmetry points are just copies of interior points. There are parameters to suppress this, e.g.
CarpetIOHDF5::output_symmetry_points (try setting this to "no")
You could also manually remove the symmetry points by clipping your image at the symmetry plane z=0.
-erik
On Wed, Jan 16, 2013 at 7:08 AM, Vassilios Mewes vassilios.mewes@uv.eswrote:
sorry for the messages before, hopefully the mail is now small enough, but i thought that adding a plot might explain better what i mean..
Hello all,
i recently read the Reisswig et al. 2012 paper and started trying to switch to cell-centered grid in order to be able to use the LSUThorns/Refluxing thorn. i am trying to simulate BH+torus systems and due to the size of the torus its hard to have it contained within a refinement level, so i thought that using a cell-centered grid in order to use refluxing might improve results..
i however run into problems getting the hdf5 output of 3D grid frundtions to work...
using the static_tov_cc_rf.par file from the Refluxing trunk, i get weird output in the mesh at the reflection boundaries (the par file uses octant mode)..
i am using the following parameters for CarpetIOHDF5:
IOHDF5::out_every = 256 IOHDF5::one_file_per_group = no IOHDF5::output_symmetry_points = no IOHDF5::out3D_ghosts = no IOHDF5::output_ghost_points = no IOHDF5::out3D_outer_ghosts = no IOHDF5::output_boundary_points = no IOHDF5::output_buffer_points = no IOHDF5::compression_level = 9 IOHDF5::use_checksums = yes IOHDF5::out_vars = " HydroBase::rho HydroBase::press HydroBase::eps HydroBase::vel ADMBase::lapse ADMBase::metric ADMBase::curv GRHydro::scon "
the simulations seems to work fine, so is the carpetiohdf5 thorn not suitable for cell-centered output? another effect (that might be output related) is that the different refinement levels are shifted (i'll attach a file showing this in the TOV from the par file (i added extra refinement levels to illustrate the effect) as well as a plot of the density in the torus)...
are the specific parameters for cell-centered hdf5 output or other thorns that could take care of that?
best wishes,
Vassili
Users mailing list Users@einsteintoolkit.org http://lists.einsteintoolkit.org/mailman/listinfo/users

Hello Vasilios,
sorry for the messages before, hopefully the mail is now small enough, but i thought that adding a plot might explain better what i mean..
Plots are welcome. EMail sizes is not terribly important, we all have fast connections :-)
IOHDF5::one_file_per_group = no IOHDF5::output_symmetry_points = no IOHDF5::out3D_ghosts = no IOHDF5::output_ghost_points = no IOHDF5::out3D_outer_ghosts = no IOHDF5::output_boundary_points = no IOHDF5::output_buffer_points = no
are the specific parameters for cell-centered hdf5 output or other thorns that could take care of that?
I will give you somewhat of the opposite advise that Erik just did. Certainly what Erik suggested is not a bad idea to get rid of some of th symmetry plane junk. The other option is to add a "Clip" operator (maybe with an origin of 1e-3 rather than 0) to the plot.
Also I would try to successively change the "no"s above to "yes", in particular the one for ghost zones since new versions of VisIt do indeed use ghost zones for smooth transitions between blocks. With vertex centering this might show up as a white line, with cell centering possibly as the offset in data that you see at around point (15,8).
Note that found the best way to get trustworthy plots for debugging out of VisIt is to add a "Threshold" operator selecting its point mesh option, then making the point size in a pseudocolor plot a bit larger. This gives you one dot per grid point with no strange interpolation in between.
Yours, Roland
Hello,
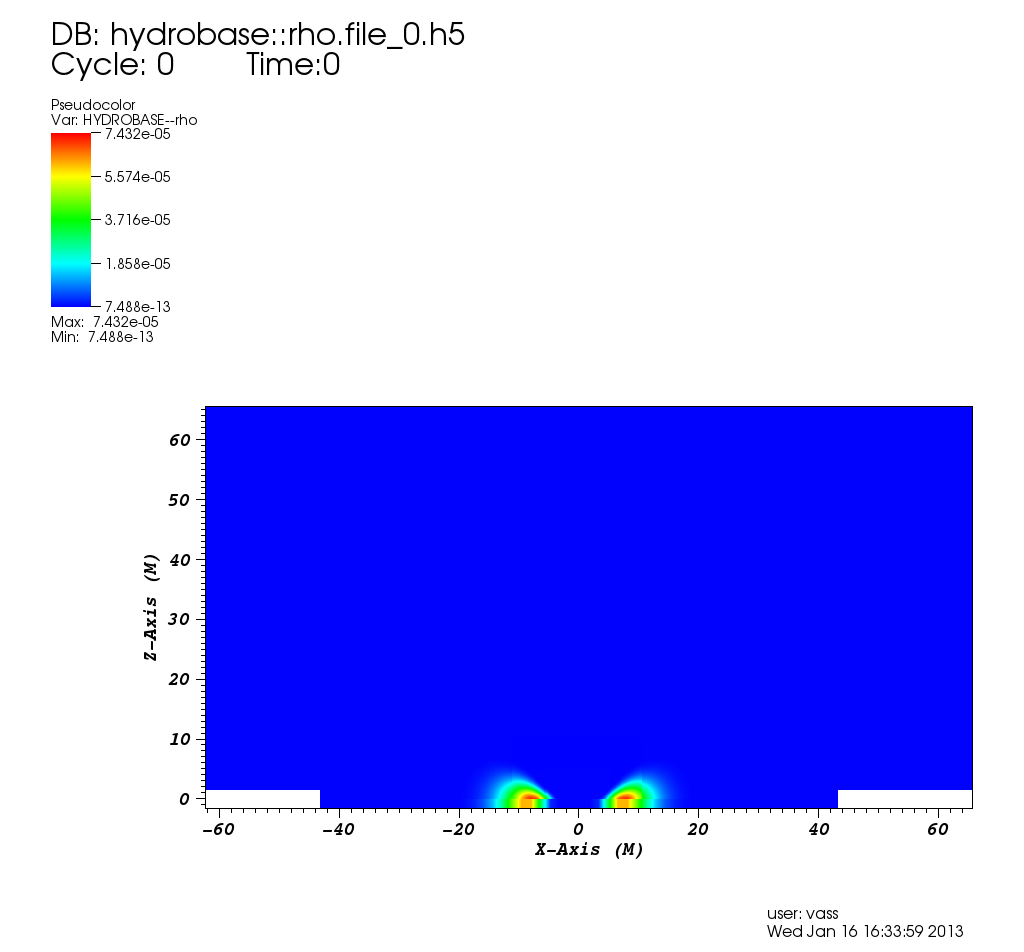
i played around with those parameters, but it didn't seem to change anything... what strikes me as most strange is that the first refinement level has points at z<0, but the largest grid has not...
so when using the clip operator, there is still some blanks where the points of the largest grid should be..i dont get why the points for the largest grid are not output there whereas they are for the other grids.. using the threshold operator works, but as you said more for debugging, and contour plots are not possible either/show the same discontinuities...
i am using visit 2.4.2, were there improvements relevant to this issues that would make it worth upgrading to 2.6?
best wishes,
Vassili
On Wed, Jan 16, 2013 at 2:32 PM, Roland Haas <roland.haas@physics.gatech.edu
wrote:
Hello Vasilios,
sorry for the messages before, hopefully the mail is now small enough,
but
i thought that adding a plot might explain better what i mean..
Plots are welcome. EMail sizes is not terribly important, we all have fast connections :-)
IOHDF5::one_file_per_group = no IOHDF5::output_symmetry_points = no IOHDF5::out3D_ghosts = no IOHDF5::output_ghost_points = no IOHDF5::out3D_outer_ghosts = no IOHDF5::output_boundary_points = no IOHDF5::output_buffer_points = no
are the specific parameters for cell-centered hdf5 output or other thorns that could take care of that?
I will give you somewhat of the opposite advise that Erik just did. Certainly what Erik suggested is not a bad idea to get rid of some of th symmetry plane junk. The other option is to add a "Clip" operator (maybe with an origin of 1e-3 rather than 0) to the plot.
Also I would try to successively change the "no"s above to "yes", in particular the one for ghost zones since new versions of VisIt do indeed use ghost zones for smooth transitions between blocks. With vertex centering this might show up as a white line, with cell centering possibly as the offset in data that you see at around point (15,8).
Note that found the best way to get trustworthy plots for debugging out of VisIt is to add a "Threshold" operator selecting its point mesh option, then making the point size in a pseudocolor plot a bit larger. This gives you one dot per grid point with no strange interpolation in between.
Yours, Roland
-- My email is as private as my paper mail. I therefore support encrypting and signing email messages. Get my PGP key from http://keys.gnupg.net.
Users mailing list Users@einsteintoolkit.org http://lists.einsteintoolkit.org/mailman/listinfo/users
Hello Vassilios,
i played around with those parameters, but it didn't seem to change anything...
Hmm. Did you try with all options set to "yes" (or just remove them since "yes" is the default)? Also do you produce 3d or 2d output (out2d_vars vs. out_vars or our3d_vars [out_vars will likely not respect all choices])?
I just gave the attached parfile a try (modified static_tov). Things seem to work fine there (but then I output all buffer and ghost points).
Yours, Roland
Hello Roland,
just tried the par file you attached quickly, same problem, this time omitting (hence leaving them as "yes") the hdf5 options....same problem...is your hdf5 output regular?
which version of visit do you use?
i was using out_vars before, and changing the hdf5 options didn't seem to change anything..
this is using the latest trunk (checked out yesterday), but i am getting the same behaviour for ET_2012_11.
best wishes,
Vassili
On Wed, Jan 16, 2013 at 5:29 PM, Roland Haas <roland.haas@physics.gatech.edu
wrote:
Hello Vassilios,
i played around with those parameters, but it didn't seem to change anything...
Hmm. Did you try with all options set to "yes" (or just remove them since "yes" is the default)? Also do you produce 3d or 2d output (out2d_vars vs. out_vars or our3d_vars [out_vars will likely not respect all choices])?
I just gave the attached parfile a try (modified static_tov). Things seem to work fine there (but then I output all buffer and ghost points).
Yours, Roland
-- My email is as private as my paper mail. I therefore support encrypting and signing email messages. Get my PGP key from http://keys.gnupg.net.
Users mailing list Users@einsteintoolkit.org http://lists.einsteintoolkit.org/mailman/listinfo/users
Hello Vassilios,
just tried the par file you attached quickly, same problem, this time omitting (hence leaving them as "yes") the hdf5 options....same problem...is your hdf5 output regular?
I used current trunk of everything. I do get a plot that looks like the one you attach, which the one I would expect to see. There might be several reasons why we only see the coarsest level extent beyond the boundary some of which might be that VisIt just chops off the overlap (since it does try to remove the ghost zones). It's just artificial in any case and for a proper plot I'd add a clip to remove the negative extents and a reflect to produce a plot covering all quadrants anyway so I never worried about this. I would be more worried if I would still see the visible offset when going from one refinement level to the other but right now the data does not cross levels.
which version of visit do you use?
I used visit 2.4.2
this is using the latest trunk (checked out yesterday), but i am getting the same behaviour for ET_2012_11.
I have not tried the release version but think it should not differ since there were no changes to HDF5 that I am aware of since then.
Yours, Roland
users@lists.einsteintoolkit.org
-
 Erik Schnetter
 -
 Roland Haas
 -
 Vassilios Mewes