
On 1 Feb 2018, at 04:47, 林家暉 r06222015@ntu.edu.tw wrote:
Dear Roland and whom it may concern, I have done the simulation of the example code of GW150914. However when I tried to visualize the result by VisIt ( https://docs.einsteintoolkit.org/et-docs/GW150914_VisIt_Tutorial#Installing_... ), I can not find the .vtk files which represent the shape and properties of relevant 2D topological spheres in the output data. Only .h5 files are in my output file. What is the possible reason for it ?
If you look at the parameter file, it has the lines
# out3d_every = rl0_every * 2 out3d_every = 0
You need to swap the comment, so that it reads
out3d_every = rl0_every * 2 # out3d_every = 0
i.e. you need to have a nonzero out3d_every parameter.
The default in the parameter file is NOT to output this 3D data, as it totals 3 TB for the whole simulation, which is more than most people want to generate! Note that this parameter is used for both the 3D gridfunction output, as well as the horizon surface data (in VTK files).
If you just want the horizon files, then you can change
QuasiLocalMeasures::output_vtk_every = $out3d_every
to
QuasiLocalMeasures::output_vtk_every = $rl0_every * 2
without changing out3d_every.
I'm afraid you will have to rerun the simulation, as the VTK files were not generated when you ran it the first time.
By the way , I have commended some module load in the edison.ini file, listed below: # module load cray-petsc/3.7.6.0 # module load curl/7.28.1 # module load hwloc/1.7.2 # module load numactl/2.0.10 I wonder whether this module commended resulted in the disappearance of .vtk files.
No, this should be unrelated.

Dear Ian and whom it may concern,
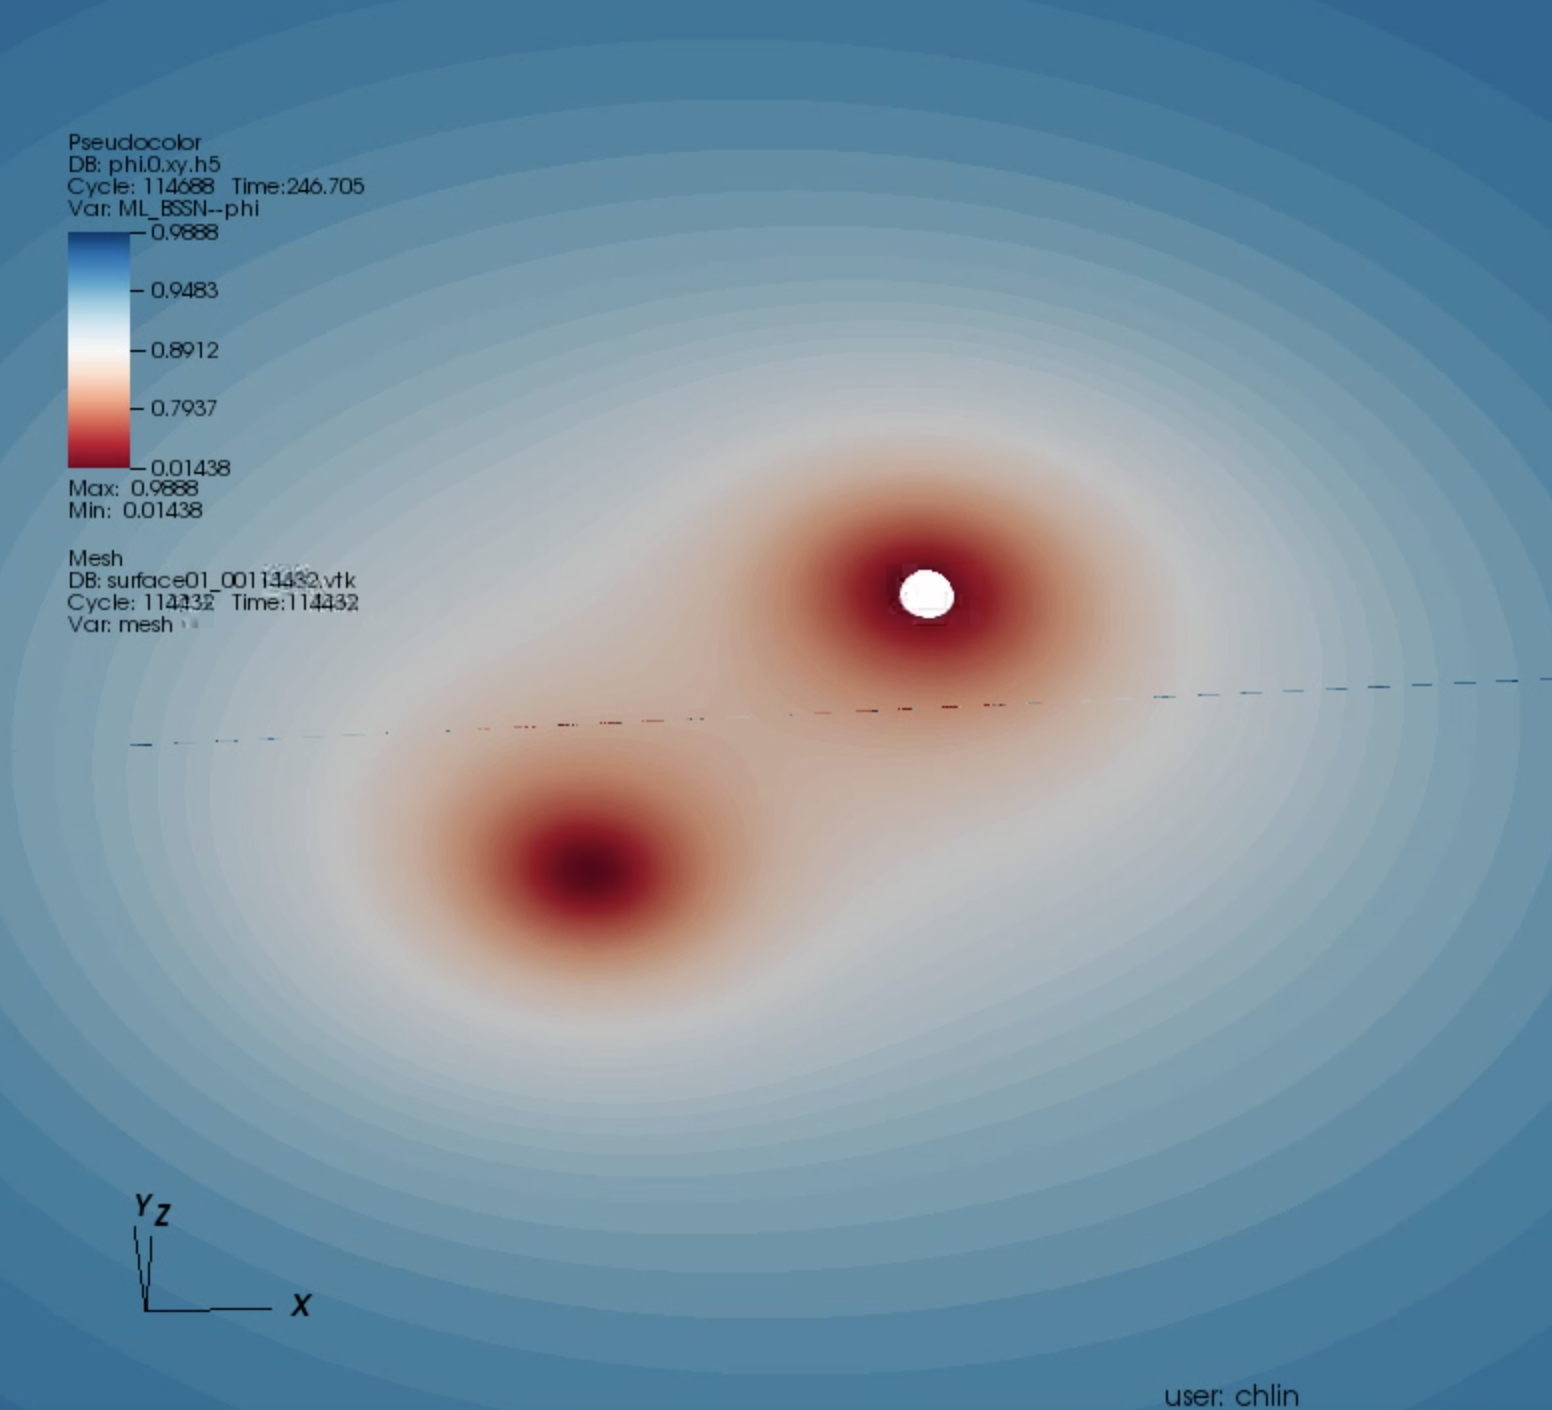
Thank you very much and I successfully plot the surface of the 2D topological spheres ,as showed below. However I found there is always a line in the plot from the right to the left and through the center . What is the possible reason of it ? For instance , resolution or something else. Best regards,
Chia-Hui Lin
[cid:99ac105d-96fb-4bb0-af9e-92208f219945]
________________________________ 寄件者: ian.hinder@aei.mpg.de ian.hinder@aei.mpg.de 寄件日期: 2018年2月2日 上午 06:45:01 收件者: 林家暉 副本: rhaas@ncsa.illinois.edu; Einstein Toolkit Users; Eloisa Bentivegna 主旨: Re: [Users] questions about compilation
On 1 Feb 2018, at 04:47, 林家暉 r06222015@ntu.edu.tw wrote:
Dear Roland and whom it may concern, I have done the simulation of the example code of GW150914. However when I tried to visualize the result by VisIt ( https://docs.einsteintoolkit.org/et-docs/GW150914_VisIt_Tutorial#Installing_... ), I can not find the .vtk files which represent the shape and properties of relevant 2D topological spheres in the output data. Only .h5 files are in my output file. What is the possible reason for it ?
If you look at the parameter file, it has the lines
# out3d_every = rl0_every * 2 out3d_every = 0
You need to swap the comment, so that it reads
out3d_every = rl0_every * 2 # out3d_every = 0
i.e. you need to have a nonzero out3d_every parameter.
The default in the parameter file is NOT to output this 3D data, as it totals 3 TB for the whole simulation, which is more than most people want to generate! Note that this parameter is used for both the 3D gridfunction output, as well as the horizon surface data (in VTK files).
If you just want the horizon files, then you can change
QuasiLocalMeasures::output_vtk_every = $out3d_every
to
QuasiLocalMeasures::output_vtk_every = $rl0_every * 2
without changing out3d_every.
I'm afraid you will have to rerun the simulation, as the VTK files were not generated when you ran it the first time.
By the way , I have commended some module load in the edison.ini file, listed below: # module load cray-petsc/3.7.6.0 # module load curl/7.28.1 # module load hwloc/1.7.2 # module load numactl/2.0.10 I wonder whether this module commended resulted in the disappearance of .vtk files.
No, this should be unrelated.
-- Ian Hinder http://members.aei.mpg.de/ianhin
On 9 Feb 2018, at 07:01, 林家暉 r06222015@ntu.edu.tw wrote:
Dear Ian and whom it may concern, Thank you very much and I successfully plot the surface of the 2D topological spheres ,as showed below. However I found there is always a line in the plot from the right to the left and through the center . What is the possible reason of it ? For instance , resolution or something else.
Hi,
I think this is a visualisation artefact; i.e. it is a problem in either VisIt or the Carpet plugin for VisIt; it's not a problem in the simulation itself.
I seem to remember that there was a way to avoid this by first "slicing" the NxMx1 3D dataset that Carpet produces to be an NxM 2D dataset, so that VisIt knows it is 2D, but I think when I tried this, it didn't work. Perhaps someone who is more expert in VisIt could suggest something?
Dear Ian,
Thanks for your reply.
Besides VisIt, I also tried SimulationTools as another way to analyze data.
However I do not have Mathematica installed in my local machine(which is a laptop) , so I tried to use the Mathematica in Edison. But it seems that I do not have permission to load a new tool on the cluster. Is there any method can I use it on a super cluster?
Best regards,
Chia-Hui Lin
________________________________ 寄件者: ian.hinder@aei.mpg.de ian.hinder@aei.mpg.de 寄件日期: 2018年2月9日 下午 07:05:10 收件者: 林家暉 副本: rhaas@ncsa.illinois.edu; Einstein Toolkit Users; Eloisa Bentivegna 主旨: Re: [Users] questions about compilation
On 9 Feb 2018, at 07:01, 林家暉 r06222015@ntu.edu.tw wrote:
Dear Ian and whom it may concern, Thank you very much and I successfully plot the surface of the 2D topological spheres ,as showed below. However I found there is always a line in the plot from the right to the left and through the center . What is the possible reason of it ? For instance , resolution or something else.
Hi,
I think this is a visualisation artefact; i.e. it is a problem in either VisIt or the Carpet plugin for VisIt; it's not a problem in the simulation itself.
I seem to remember that there was a way to avoid this by first "slicing" the NxMx1 3D dataset that Carpet produces to be an NxM 2D dataset, so that VisIt knows it is 2D, but I think when I tried this, it didn't work. Perhaps someone who is more expert in VisIt could suggest something?
-- Ian Hinder http://members.aei.mpg.de/ianhin
On 9 Feb 2018, at 16:33, 林家暉 <r06222015@ntu.edu.tw mailto:r06222015@ntu.edu.tw> wrote:
Dear Ian, Thanks for your reply. Besides VisIt, I also tried SimulationTools as another way to analyze data. However I do not have Mathematica installed in my local machine(which is a laptop) , so I tried to use the Mathematica in Edison. But it seems that I do not have permission to load a new tool on the cluster. Is there any method can I use it on a super cluster?
Hi,
I don't know what you mean "permission to load a new tool on the cluster". You can install SimulationTools into your home directory, as described in the installation instructions. This should not need any special technical permissions. If this is what you tried, and it doesn't work, can you give some more details about what you did and what went wrong?
If you mean that you are not *allowed* to install external software in your home directory, then I don't know how you can use SimulationTools on the cluster, as it would need to be installed. In any case, in order to visualise the data, you will need a graphical display, so presumably you would need to use Mathematica with X forwarding or similar. Unless you have quite a fast connection to the cluster, this might be too slow to be usable. There is no problem with using SimulationTools in Mathematica from the command line or in scripts, but I suspect that's not really what you need.
What I usually do is copy the required data from the cluster to my laptop, and visualise it with SimulationTools in Mathematica on my laptop. If the data is too big to transfer, I use Mathematica's "remote kernel" feature, where the notebook interface runs on my laptop, and the kernel runs on the cluster, where it can directly access the data. This way, only the visualisation needs to be sent over the network, not the original raw data. Of course, Mathematica is very expensive, so this might not be an ideal solution for you.
On 9 Feb 2018, at 16:33, 林家暉 <r06222015@ntu.edu.tw mailto:r06222015@ntu.edu.tw> wrote:
Dear Ian, Thanks for your reply. Besides VisIt, I also tried SimulationTools as another way to analyze data. However I do not have Mathematica installed in my local machine(which is a laptop) , so I tried to use the Mathematica in Edison. But it seems that I do not have permission to load a new tool on the cluster. Is there any method can I use it on a super cluster?
Hi,
I don't know what you mean "permission to load a new tool on the cluster". You can install SimulationTools into your home directory, as described in the installation instructions. This should not need any special technical permissions. If this is what you tried, and it doesn't work, can you give some more details about what you did and what went wrong?
If you mean that you are not *allowed* to install external software in your home directory, then I don't know how you can use SimulationTools on the cluster, as it would need to be installed. In any case, in order to visualise the data, you will need a graphical display, so presumably you would need to use Mathematica with X forwarding or similar. Unless you have quite a fast connection to the cluster, this might be too slow to be usable. There is no problem with using SimulationTools in Mathematica from the command line or in scripts, but I suspect that's not really what you need.
What I usually do is copy the required data from the cluster to my laptop, and visualise it with SimulationTools in Mathematica on my laptop. If the data is too big to transfer, I use Mathematica's "remote kernel" feature, where the notebook interface runs on my laptop, and the kernel runs on the cluster, where it can directly access the data. This way, only the visualisation needs to be sent over the network, not the original raw data. Of course, Mathematica is very expensive, so this might not be an ideal solution for you.
Dear Ian,
I followed the steps in this page:
http://simulationtools.org/Documentation/English/Tutorials/Introduction.html
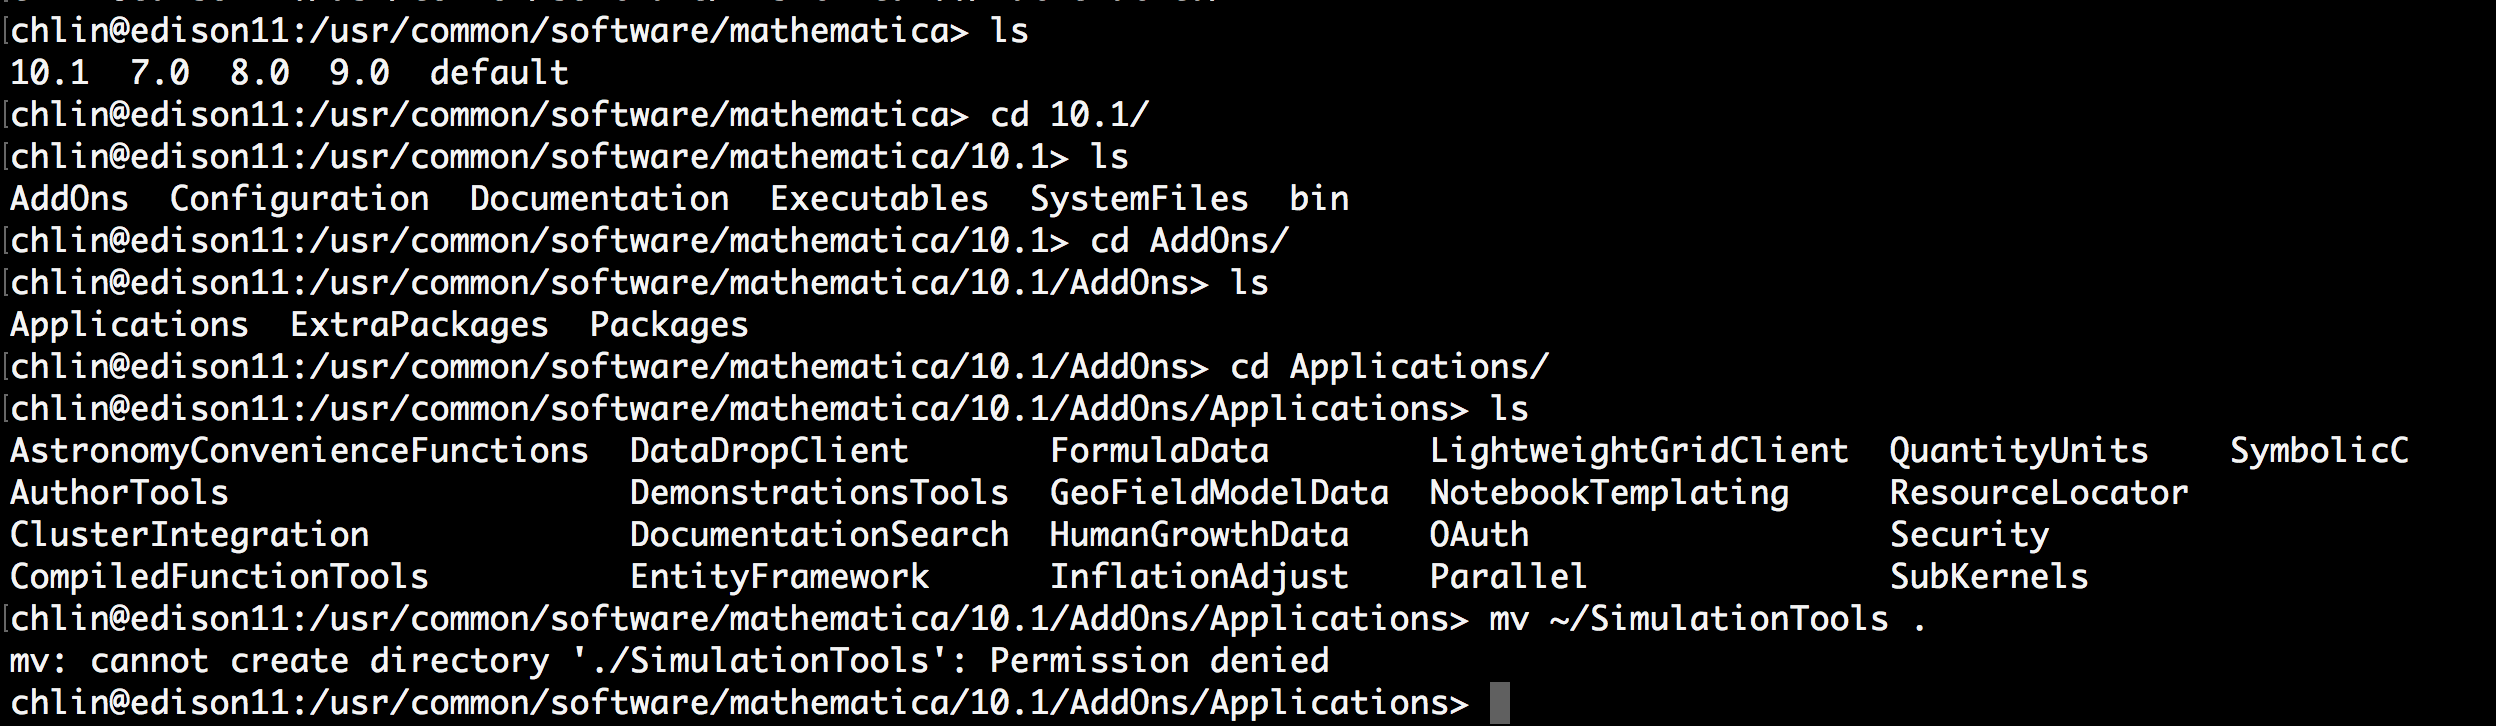
I have installed both SimulationTools and h5mma into my home directory in Edison, but I cannot move it to ~/Library/Mathematica/Applications which seems to be a required step :
[cid:0236c56d-986a-4a2f-97f9-43516b47327e] the message is below:
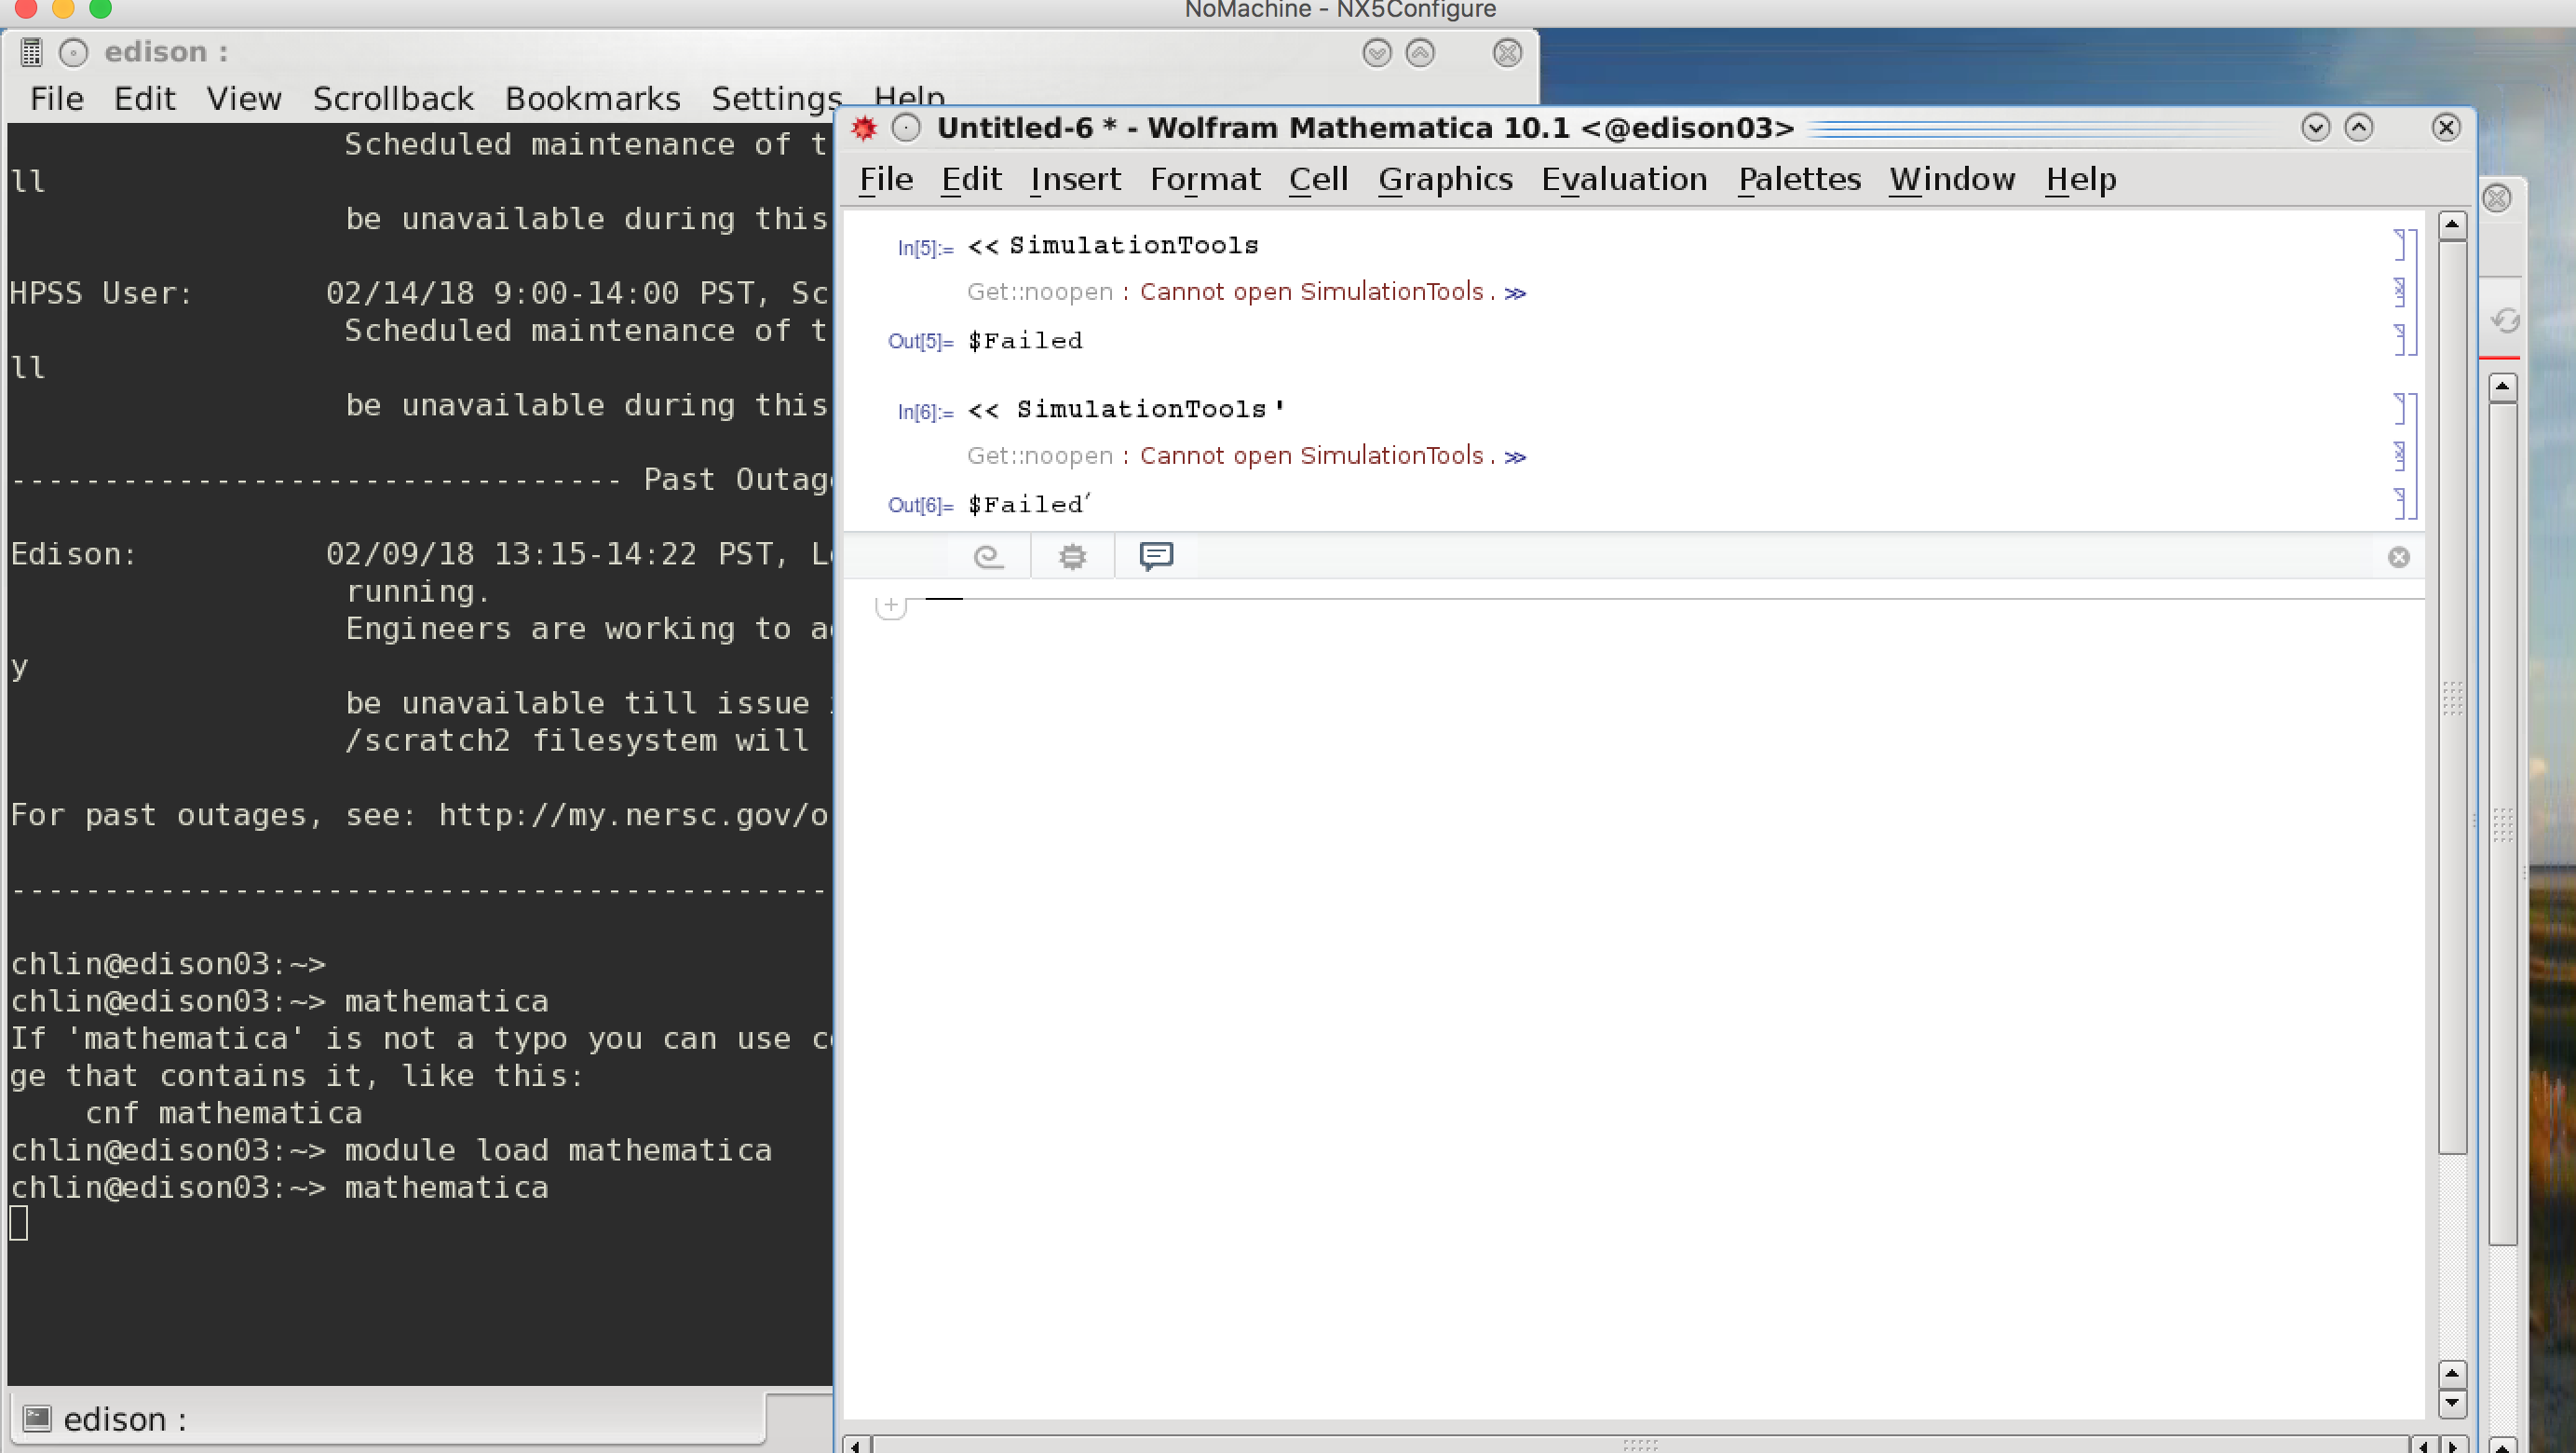
[cid:31afc672-e8f7-4e8c-a2e0-8ad7f243a9af] By the way, I have installed NX,which is a computer program that handles remote X Window System connections to run Methematica. And I tried directly load SimulationTools (maybe there is SimulationTools already installed in Edison, or maybe I can load SimulationTools even it is located in my home directory) like below:
[cid:1aafd2b5-c35a-4685-9a54-48ee0ab372a0] It failed, so SimulationTools seems to be required to move to Application directory of Mathematica.
Best regards,
Chia-Hui Lin
________________________________ 寄件者: ian.hinder@aei.mpg.de ian.hinder@aei.mpg.de 寄件日期: 2018年2月10日 上午 05:29:23 收件者: 林家暉 副本: rhaas@ncsa.illinois.edu; Einstein Toolkit Users; Eloisa Bentivegna 主旨: Re: [Users] questions about compilation
On 9 Feb 2018, at 16:33, 林家暉 <r06222015@ntu.edu.twmailto:r06222015@ntu.edu.tw> wrote:
Dear Ian, Thanks for your reply. Besides VisIt, I also tried SimulationTools as another way to analyze data. However I do not have Mathematica installed in my local machine(which is a laptop) , so I tried to use the Mathematica in Edison. But it seems that I do not have permission to load a new tool on the cluster. Is there any method can I use it on a super cluster?
Hi,
I don't know what you mean "permission to load a new tool on the cluster". You can install SimulationTools into your home directory, as described in the installation instructions. This should not need any special technical permissions. If this is what you tried, and it doesn't work, can you give some more details about what you did and what went wrong?
If you mean that you are not *allowed* to install external software in your home directory, then I don't know how you can use SimulationTools on the cluster, as it would need to be installed. In any case, in order to visualise the data, you will need a graphical display, so presumably you would need to use Mathematica with X forwarding or similar. Unless you have quite a fast connection to the cluster, this might be too slow to be usable. There is no problem with using SimulationTools in Mathematica from the command line or in scripts, but I suspect that's not really what you need.
What I usually do is copy the required data from the cluster to my laptop, and visualise it with SimulationTools in Mathematica on my laptop. If the data is too big to transfer, I use Mathematica's "remote kernel" feature, where the notebook interface runs on my laptop, and the kernel runs on the cluster, where it can directly access the data. This way, only the visualisation needs to be sent over the network, not the original raw data. Of course, Mathematica is very expensive, so this might not be an ideal solution for you.
-- Ian Hinder http://members.aei.mpg.de/ianhin

On 10 Feb 2018, at 06:11, 林家暉 r06222015@ntu.edu.tw wrote:
Dear Ian, I followed the steps in this page: http://simulationtools.org/Documentation/English/Tutorials/Introduction.html http://simulationtools.org/Documentation/English/Tutorials/Introduction.html I have installed both SimulationTools and h5mma into my home directory in Edison, but I cannot move it to ~/Library/Mathematica/Applications which seems to be a required step : <螢幕快照 2018-02-10 下午1.31.47.png> the message is below: <螢幕快照 2018-02-10 下午1.38.10.png>
Hi,
The instructions say
SimulationTools is available as a tar.gz file containing the SimulationTools application directory. The SimulationTools directory should be placed in ~/Library/Mathematica/Applications on Mac OS, and ~/.Mathematica/Applications on Linux.
Since you are using Linux on Edison, you need to place it in ~/.Mathematica/Application, which is in your home directory.
There are equivalent download instructions at
http://simulationtools.org/download.shtml http://simulationtools.org/download.shtml
which might clarify this.
By the way, I have installed NX,which is a computer program that handles remote X Window System connections to run Methematica. And I tried directly load SimulationTools (maybe there is SimulationTools already installed in Edison, or maybe I can load SimulationTools even it is located in my home directory) like below: <螢幕快照 2018-02-10 下午2.03.30.png> It failed, so SimulationTools seems to be required to move to Application directory of Mathematica.
Yes, that should fix the problem.
NX is good; that should be fast enough to use Mathematica remotely.
Good luck, and please keep asking questions if you need help!
Dear Ian,
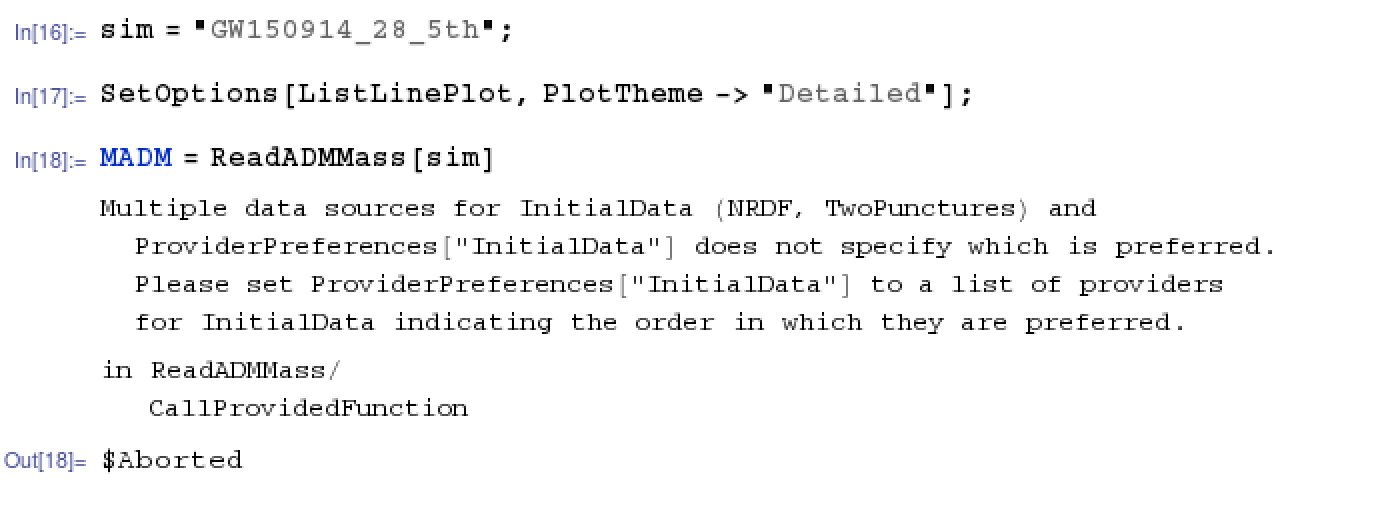
Sorry that I did not notice that I used a wrong directory. And after I corrected , it works! Since I wanted to plot gravitational waveforms, I followed the steps in the Wolfram CDF file about gravitational waveforms. However I met a problem when I want to read ADM mass : [cid:726c55ed-cf9c-4469-9919-fc02d6b4c150] Since it is my first time to use Mathematica, I am not sure what this error message is about. How should I set ProviderPreferences["InitialData"]?
Best regards,
Chia-Hui Lin
________________________________ 寄件者: ian.hinder@aei.mpg.de ian.hinder@aei.mpg.de 寄件日期: 2018年2月10日 下午 04:31:02 收件者: 林家暉 副本: rhaas@ncsa.illinois.edu; Einstein Toolkit Users; Eloisa Bentivegna 主旨: Re: [Users] questions about compilation
On 10 Feb 2018, at 06:11, 林家暉 <r06222015@ntu.edu.twmailto:r06222015@ntu.edu.tw> wrote:
Dear Ian, I followed the steps in this page: http://simulationtools.org/Documentation/English/Tutorials/Introduction.html I have installed both SimulationTools and h5mma into my home directory in Edison, but I cannot move it to ~/Library/Mathematica/Applications which seems to be a required step : <螢幕快照 2018-02-10 下午1.31.47.png> the message is below: <螢幕快照 2018-02-10 下午1.38.10.png>
Hi,
The instructions say
SimulationTools is available as a tar.gz file containing the SimulationTools application directory. The SimulationTools directory should be placed in ~/Library/Mathematica/Applications on Mac OS, and ~/.Mathematica/Applications on Linux.
Since you are using Linux on Edison, you need to place it in ~/.Mathematica/Application, which is in your home directory.
There are equivalent download instructions at
http://simulationtools.org/download.shtml
which might clarify this.
By the way, I have installed NX,which is a computer program that handles remote X Window System connections to run Methematica. And I tried directly load SimulationTools (maybe there is SimulationTools already installed in Edison, or maybe I can load SimulationTools even it is located in my home directory) like below: <螢幕快照 2018-02-10 下午2.03.30.png> It failed, so SimulationTools seems to be required to move to Application directory of Mathematica.
Yes, that should fix the problem.
NX is good; that should be fast enough to use Mathematica remotely.
Good luck, and please keep asking questions if you need help!
-- Ian Hinder http://members.aei.mpg.de/ianhin
users@lists.einsteintoolkit.org
-
 ian.hinder@aei.mpg.de
 -
 林家暉
林家暉